11.7. Analyzing the Solution Statistics for ALL SESSIONS
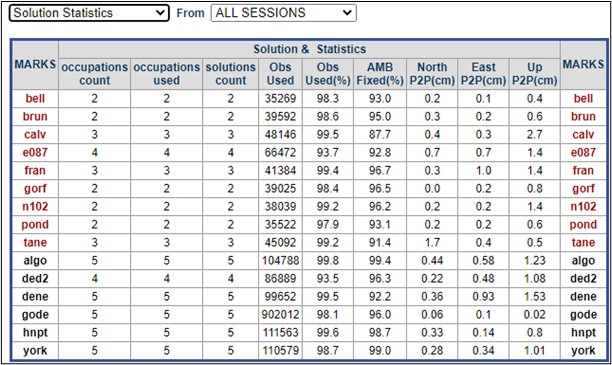
When multiple sessions have been processed, the Solution Statistics (FOR ALL SESSIONS), available at the bottom of the Managers Page, should also be analyzed (see Fig. 11.19). This same pull-down selector gives access to convenient information in a tabular form. These tables can be highlighted and copy/pasted into spreadsheets or documents.

Fig. 11.19 Example solution statistics for all sessions
Review the “peak-to-peak” (“P2P”) values in the table for both the marks observed (given in red) and for the CORS (given in black). Smaller is better. See Glossary for more information on P2P. Values higher than those established in the project preferences should be investigated.
Use the Session Solution “Summary” page for each session that has a mark or CORS with a high P2P to further investigate the cause of the high P2P.
If you have high P2P values, drill down to the corresponding Mark Page to see what happened with that particular observation.
If the user finds a blunder or other easily rectified error, then either that particular observation, or just the corresponding session will have to be reprocessed (depending on where the error lies, and whether it can be fixed within the project itself). Examples of blunders include wrong antenna type or wrong antenna height, as well as wrong association of the observation with its corresponding mark. Check the field logs to verify that the correct information has been entered regarding the corresponding observation(s).
If the user cannot isolate the error, the user may decide to remove the mark from the survey. In that case, the corresponding session(s) will have to be re-processed.
Caution
If removing an observation on a mark removes redundancy, NGS cannot accept only one solution on a mark (the user may want to re-observe)
Repeat Vectors Check (optional)
In smaller projects for which the single hub model is appropriate, the repeat vectors all emanate from that single hub. Therefore a simple cumulative tabulation of the *.vec results from the sessions can be assembled for manual inspection looking for repeat vectors which fall outside the manager’s expected tolerances. This can be done by importing the data into a spreadsheet, or using third-party software. For larger projects, this is cumbersome and should probably be left to the COMPVECS results produced later in network solutions (see Section 12.6.3).