Multi-Year CORS Solution 1 (MYCS1)
MYCS1 was replaced by MYCS2 in July 2019. MYCS2 is here!
On this page:
- Multi-Year CORS Solution 1 (MYCS1): Why Process?
- MYCS1 Processing
- Main Changes From Previous Reference Frames
- Velocity Fields relative to IGS08 epoch 2005.00 and NAD83(2011) epoch 2010.00
- MYCS1 Coordinate Monitoring
- Short-term Time-series Plots
- Long-term Time-series Plots
- ARP Position of All Processed Stations
- HTDP Transformation Parameters
Multi-Year CORS Solution 1 (MYCS1): Why Process?
NGS had elected to reprocess all its CORS data to provide a single consistent set of coordinates for all stations computed using the best available methods due to the following major changes in reference frames and the inconsistencies of NCN stations' coordinates:
- IGS introduced new global reference frame: IGS08 epoch 2005.00. More information below.
- NGS's current global frame is ITRF00 epoch 1997.00. Projecting CORS positions 13 years to the present is unrealistic.
- NGS's current plate-fixed frame is NAD83(CORS96,MARP00,PACP00) epoch 2002.00. Projecting CORS positions 8 years to the present is also questionable.
- NGS updated its National Spatial Reference System Coordinates to NAD83(2011,MA11,PA11) epoch 2010.00. More information below.
- NCN stations' coordinates are mixed coordinates from an earlier solution (1994-2002) that used only 3-8 ITRF reference frame stations to align to the global frame.
- NCN stations have mixed horizontal velocities: modeled from HTDP vs. computed.
- NCN stations have mixed vertical velocities, which for many of the NAD83(COR96,MARP00,PACP00) epoch 2002.00 stations are assigned a value of 0 mm/yr.
- NGS is switching from using relative antenna calibration to absolute antenna calibrations.
- NGS is implementing significant changes to existing processing algorithms and models including compliance with IERS conventions (i.e. software changes).
Global Reference Frame Coordinates: IGS08 epoch 2005.00
Since April 17, 2011, the National Geodetic Survey (NGS) and the International GNSS Service (IGS) have been providing GPS satellite orbits (ephemerides) that are referred to a new terrestrial reference frame, called IGS08 and defined by the IGS. This new frame is based on GPS observations and was designed to be consistent with the International Terrestrial Reference Frame of 2008 (ITRF2008). ITRF2008 is the latest frame realization of the International Earth Rotation and Reference Systems Service (IERS) and is a multi space-based geodetic technique solution, combining Very Long Baseline Interferometry (VLBI), Satellite Laser Ranging (SLR), Doppler Orbitography and Radiopositioning Integrated by Satellite (DORIS) and GPS data.
Although, the best fitting Helmert transformation between IGS08 and ITRF2008 for a set of well-established, international GNSS satellite tracking stations is the identity function, the transformed ITRF2008 positions have a statin specific "correction" applied to them to create IGS08 positions (for additional details on IGS08 consult the following IGSMAILs 6354, 6355, 6356, 6374). Thus the IGS08 position for a particular station may differ from its corresponding ITRF2008 position; however, the velocities remain identical. By using IGS08 coordinates and the associated absolute antenna calibrations in combination with IGS orbits a consistent frame is realized. In addition, NGS has updated the IGS orbits from January 1, 1994 to April 16, 2011 in its online storage with the recently released IGS reprocessed (repro1) orbits that are all aligned consistently with IGS05. For most non-research applications, users can freely mix IGS05 and IGS08 orbits to compute coordinates for control points. Additional information is available in the following IGSMAIL 6475.
National Spatial Reference System Coordinates: NAD83(2011,MA11,PA11) epoch 2010.00
On September 6, 2011, NGS updated the National Spatial Reference System NAD83(CORS96, MARP00, PACP00) positions and velocities for all CORS, to NAD83(2011, MA11, PA11).
- The NAD83(2011) frame, which is relative to the fixed North American plate, is used to define the coordinates for stations located in the CONterminous United States (CONUS), Alaska and US territories in the Caribbean.
- The NAD83(MA11) frame is realized with respect to the fixed Marianas plate and is used to define coordinates in the Marianas.
- The NAD83(PA11) is a Pacific plate fixed frame and is used to define coordinates in Hawaii, American Samoa, the Marshall Islands and other US territories residing on the Pacific Plate.
For more information about NAD83, see Modern Terrestrial Reference Systems: The Evolution of NAD83 [Snay and Soler, 2000], and Introducing Two Spatial Reference Frames for Regions of the Pacific Ocean [Snay, 2003].
The new realization of NAD83 involves no datum change, which means that, the origin, scale and orientation of NAD83(2011) are identical to those of NAD83(CORS96), and the same for the two other frames. The coordinates are not the same in the old and new realizations for multiple factors including the switch to absolute antenna calibrations, new/revised processing algorithms, improved discontinuity identification, several years of additional GPS data, change in reference epoch, and an improved definition of the global reference frame, IGS08. Concisely, the two biggest changes are caused by the change in reference epoch and the move from relative to absolute antenna calibrations.
For a description of how NAD83 is related to the global reference frame, see Realization and Unification of NAD83 in Canada and the U.S. via the ITRF [Craymer et al., 1999], and Modern Terrestrial Reference Systems, Part 1 [Snay and Soler, 1999].
Users working in Canada should consult Craymer, 2006 for a review of how NAD83 is implemented in Canada.
Multi-Year CORS (MYCS1) Processing
The NGS/CORS branch had completed a full reanalysis of all data from CORS and from a set of global stations with the goal of simultaneously computing a fully consistent set of coordinates, GPS satellite orbits and Earth Orientation Parameters (EOP). This initial Multi-Year CORS (MYCS1) effort is the first of a series of reprocessing projects that will occur periodically in the coming years. The last time a reanalysis of CORS data occurred was in 2002 and numerous inconsistencies and changes have occurred in our processing techniques since that date.
The concern over the overall quality of the solutions was not limited to NGS, but also to other geodetic groups, in particular IGS. Thus IGS requested participation in a reanalysis of all data collected since 1994 to establish a new consistent set of GPS orbits, clocks and EOPs. This project was called IG1/repro1. NGS elected to contribute to this effort as an IGS Analysis Center and used this opportunity to simultaneously reprocess all its CORS data to provide a single consistent set of coordinates for all stations computed using the best available methods.
MYCS1 processing workflow
RINEX observations from the set of global stations were reduced to obtain weekly sets of station positions, satellite orbits, and Earth Orientation Parameters, using the latest NGS PAGES software. These weekly "global" solutions were submitted to the IGS for their IG1/repro1 data reprocessing campaign). Then, CORS data were tied to the framework of the global solution on a weekly basis at the normal equation level resulting in weekly SINEX files containing the positions and full variance-covariance information for CORS plus global stations. Regularized positions and secular velocities were obtained by stacking the SINEX files with the CATREF software from Institut Géographique National (IGN), Paris, France. These new coordinates form the basis for NGS's realization of IGS08, and thus, NAD83(2011).
For a summary of the technical aspects of our RINEX data reduction strategy, please visit IGS Analysis Strategy Summary.
For additional information on the details of the stacking, visit our Preliminary Summary of the Reanalysis of GPS Data. [Note: this Preliminary Summary page has not been updated in some time and some information may be outdated.]
All the results presented on this webpage use data spanning 1 January 1994 to 16 April 2011 and are from our stacked solution using computed coordinates. No results for stations with modeled velocities are shown on this page.
Criteria for Publishing Coordinates
Due to the fact that CORS positions vary over time with at least an annual and semi-annual variation, velocities cannot be rigorously estimated until 2.5 years of data or 130 weekly solutions are analyzed. Therefore,
- The published positions and velocities for stations with more than 2.5 years of data and 130 weekly solutions are computed from our stacked solution (MYCS1).
- For the other stations, mostly new(er) stations, we compute positions in both IGS08 epoch 2005.00 and NAD83(2011) epoch 2010.00, and assign modeled velocities from the Horizontal Time Dependent Positioning (
HTDP) software to them.
The current velocity models address only the 2-dimensional horizontal components and a 0 (zero) velocity is assigned for the vertical component. Since the modeled velocities may not reflect the actual long-term motion of a CORS and it may take some time to robustly estimate the velocity directly from the data, we clearly identify that the source is either computed or modeled. After ~2.5 years we will have sufficient data to compute robust velocities and we will change the published velocities from modeled to computed values.
NCN coordinates are revised periodically using the following Continuously Operating Reference Station (CORS) Coordinate Update Policy [December 2011] (pdf document).
Main Changes From Previous Reference Frames
| Frame Type | Frame Name | Reference Epoch | Antenna PCV Type | Data Duration |
|---|---|---|---|---|
| From | ||||
| Global | ITRF2000 | 1997.00 | Relative AntCal | 1994.0-2002.0 |
| Global | ITRF00 (NGS's solution) | 1997.00 | NGS's Relative AntCal | 1994.0-present |
| Plate-fixed-North American | NAD83(CORS96) | 2002.00 | NGS's Relative AntCal | 1994.0-present |
| Plate-fixed-Pacific | NAD83(PACP00) | 2002.00 | NGS's Relative AntCal | 1994.0-present |
| Plate-fixed-Marianas | NAD83(MARP00) | 2002.00 | NGS's Relative AntCal | 1994.0-present |
| To | ||||
| Global | IGS08 | 2005.00 | IGS08 Absolute AntCal | 1997.0-2009.5 |
| Global | IGS08 (NGS's solution) | 2005.00 | IGS08 Absolute AntCal | 1994.0-2010.5 (ongoing) |
| Plate-fixed-North American | NAD83(2011) | 2010.00 | IGS08 Absolute AntCal | 1994.0-2010.5 (ongoing) |
| Plate-fixed-Pacific | NAD83(PA11) | 2010.00 | IGS08 Absolute AntCal | 1994.0-2010.5 (ongoing) |
| Plate-fixed-Marianas | NAD83(MA11) | 2010.00 | IGS08 Absolute AntCal | 1994.0-2010.5 (ongoing) |
Links to IGS on implementation of IGS08 and IGS08.atx
- Upcoming switch to IGS08/igs08.atx
- Upcoming switch to IGS08/igs08.atx - Details on igs08.atx
- Advice for coping with the change to IGS08+igs08.atx
- igs08.atx including GLONASS satellite antenna corrections
Reference Epoch: from 2002.00 to 2010.00
The published NAD83 coordinates correspond to the position of the station at January 1, 2010 (or equivalently, epoch 2010.00), and if a position at a different time is required then the published velocity must be applied and a new position computed. By using a more recent epoch, systematic errors that occur when points are positioned relative to CORS without applying to them appropriate station velocities are reduced. This more current reference epoch date will especially benefit those involved in positioning activities in areas of active crustal motion, like western CONUS and Alaska.
There has been no datum change, that is, the origin, scale and orientation of NAD83(2011,MA11,PA11) are identical to those of NAD83(CORS96,MACP00,PACP00). The changes in coordinates are driven by multiple factors including the switch to absolute antenna calibrations, new/revised processing algorithms, improved discontinuity identification, longer data sets, and our improved definition of the global reference frame. However for the end user the biggest change is caused by the new reference epoch, which has changed by 8 years from 2002.00 to 2010.00. To show how small the change in reference frames is, we compare the coordinates of all CORS with more than 2.5 years of data at the same epoch of 2002.00 in both frames.
Figure 1: Difference in positions ofNAD83(2011) epoch 2002.00 minus NAD83(CORS96) epoch 2002.00. Horizontal (left), Vertical (right).
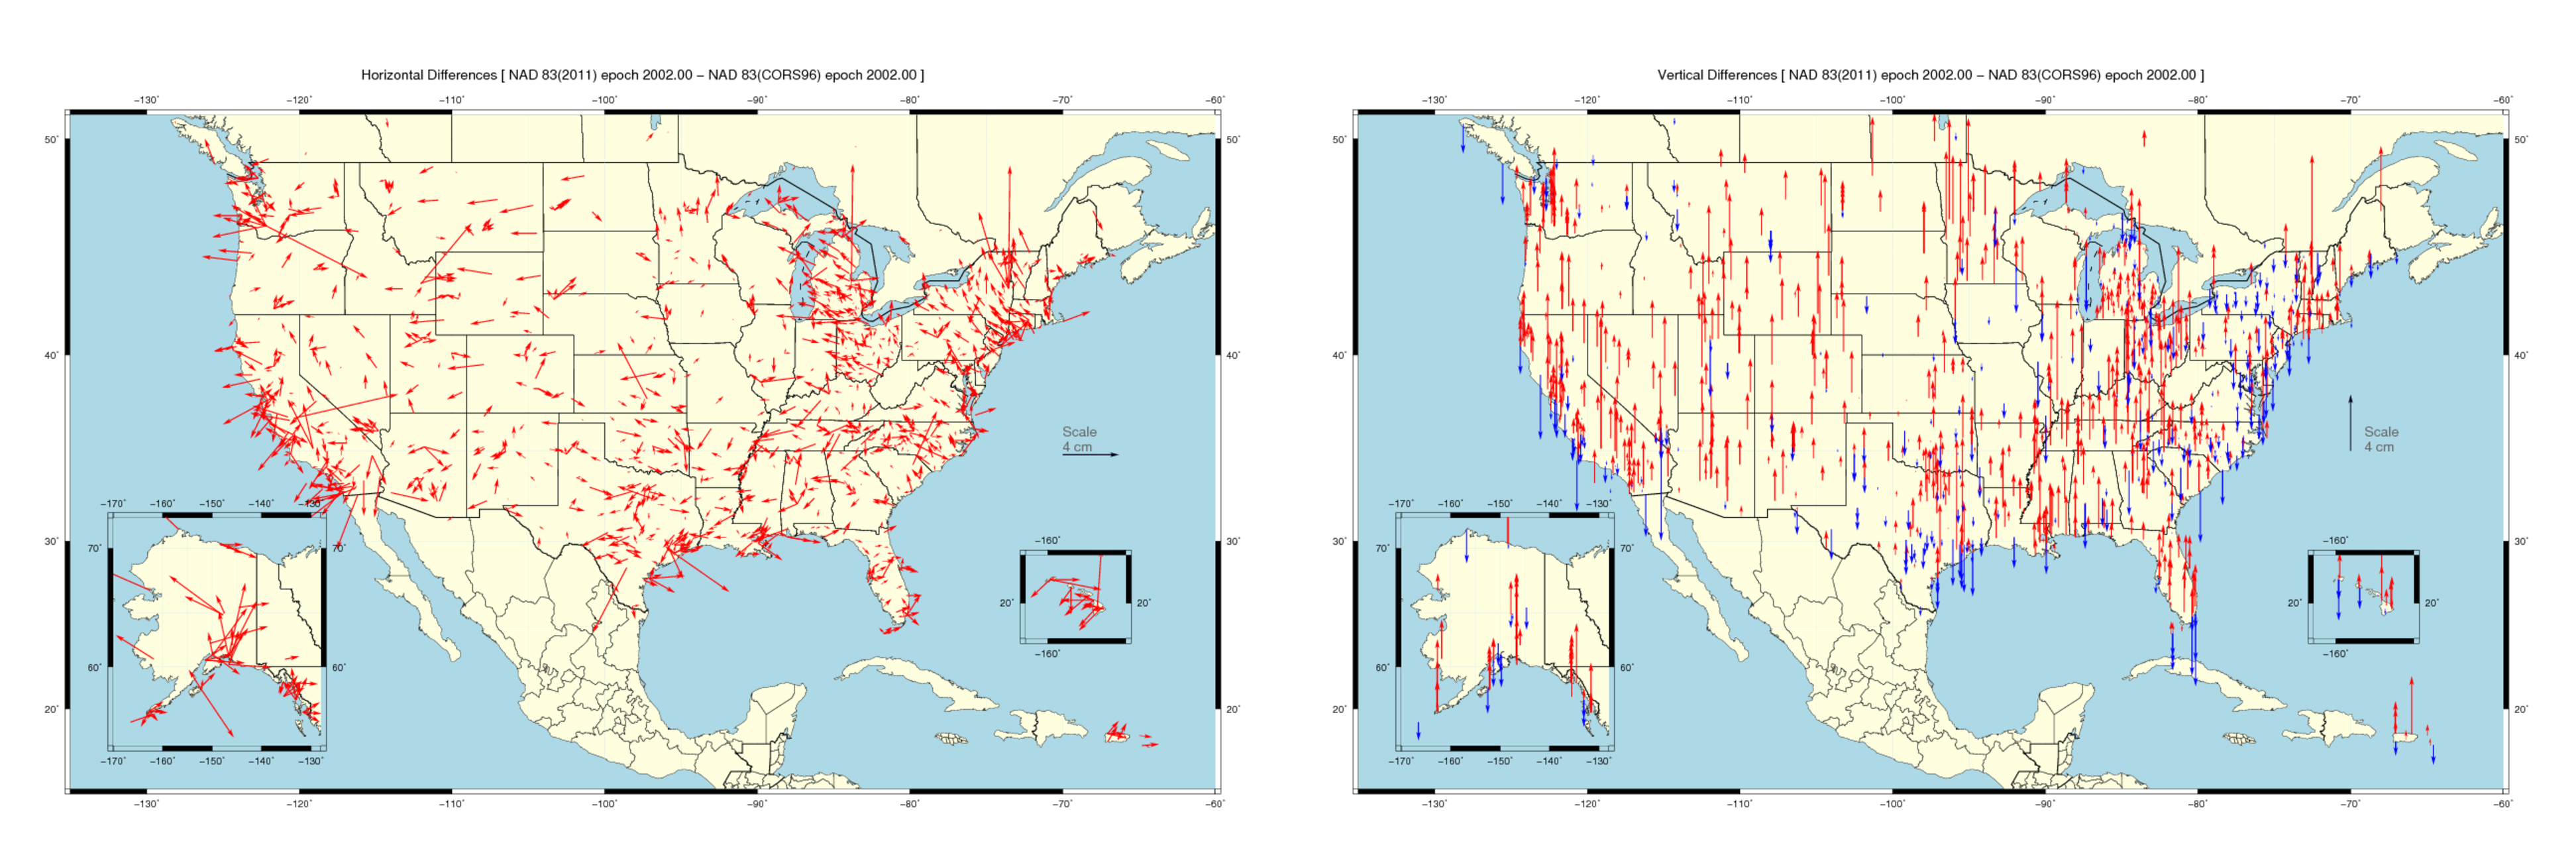
Average differences of NAD83(2011) epoch 2002.00 minus NAD83(CORS96) epoch 2002.00
| East (cm) | North (cm) | Up (cm) | |
|---|---|---|---|
| Mean value | -0.14 ± 1.04 | 0.19 ± 0.94 | 0.80 ± 1.89 |
| Median values | -0.10 | 0.20 | -0.70 |
What we see is that the changes for most stations are very small and generally random in the horizontal (left)(remember that the bulk of the stations have such small differences that they are hard to see on the map). In the vertical (right) the changes are a little larger, but more systematic, this is largely attributed to the fact that in our re-processed solution NAD83(2011), vertical velocities were computed and not assigned a 0 cm/yr velocity as occurred for many NAD83(CORS96).
Figure 2: Difference in positions ofNAD83(2011) epoch 2010.00 minus NAD83(2011) epoch 2002.00. Horizontal (left), Vertical (right).
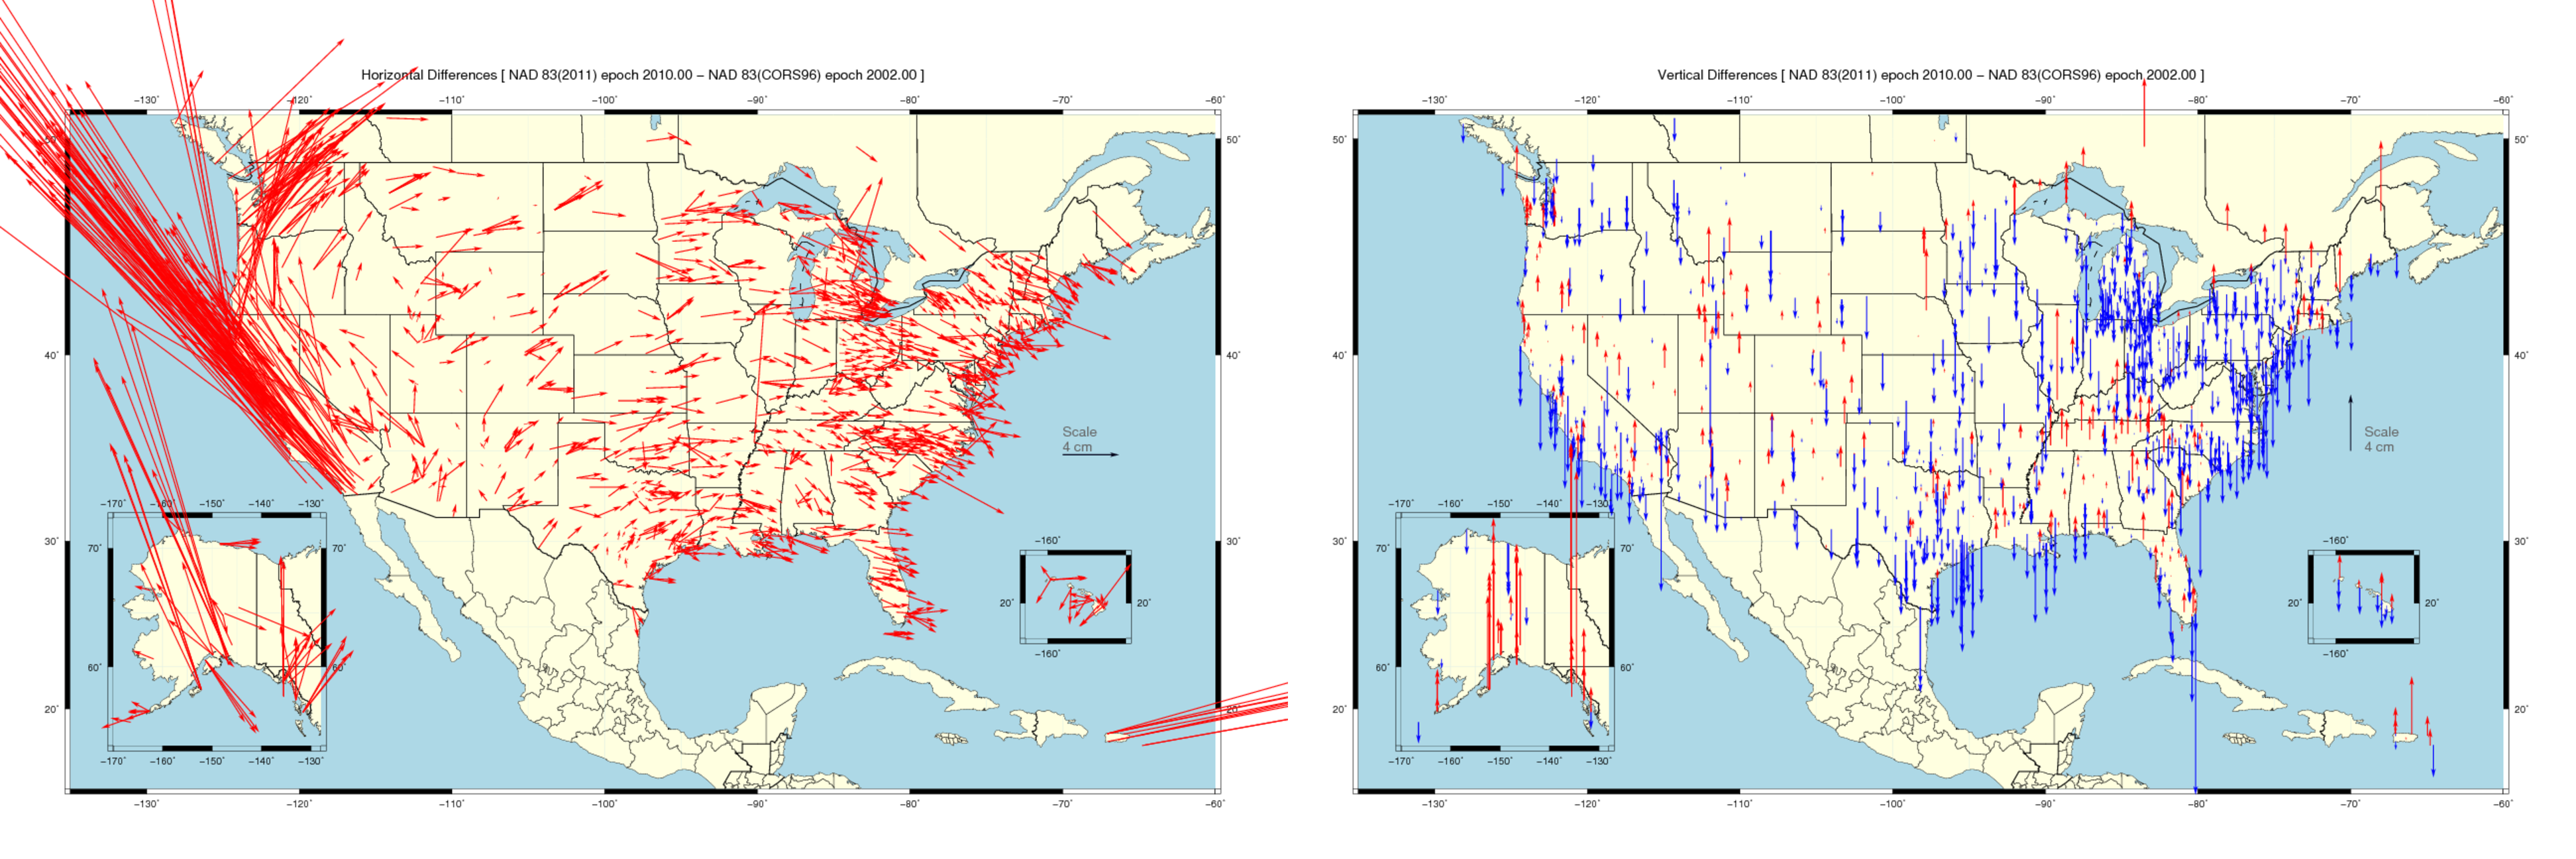
Average differences of NAD83(2011) epoch 2010.00 minus NAD83(2011) epoch 2002.00
| East (cm) | North (cm) | Up (cm) | |
|---|---|---|---|
| Mean value | 0.05 ± 5.25 | 2.12 ± 6.08 | -0.66 ± 2.24 |
| Median values | -0.12 | 0.00 | -0.80 |
What we see in Figure 2 is that the changes for most stations are larger and some systematic regional patterns unlike when we compared positions at the same epoch. The main cause of these differences reflects errors in our plate fixed (NAD83) velocity estimates. The errors however are greater than they seem since we are mixing true plate fixed stations in the Central and Eastern US with stations in the western US that are in the plate boundary zone between the Pacific and North American Plate.
Because we are comparing positions at two different epochs the differences in position are dominated by non-zero NAD83(2011) velocities. In the eastern CONUS we see a small amount of motion related to the non-zero velocities. Horizontally, in westernmost CONUS, we instead see the dominant effects of the broad deformation zone from the North American Plate to the Pacific plate in westernmost California, which is moving to the northwest. In Washington and Oregon, we see the effects of the subducting Juan de Fuca plate beneath the North American Plate. The subduction causes deformation to the northeast. Vertically (right), it appears that most positions have increased (hence arrows are negative--2010.00-2002.00) reflecting the incorrect assumption used in many NAD83(CORS96) epoch 2002.00 stations that the vertical velocities were 0 cm/yr.
Antenna Calibrations: from Relative to Absolute
Users must take special note that CORS points defined in IGS08 and NAD83(2011, MA11, PA11) differ with respect to those defined in ITRF00 and NAD83(CORS96, MARP00, PACP00) in the use of a different set of antenna calibrations. In the past, users of CORS coordinates only needed to ensure they were using the calibration for the antenna and radome pair they collected their data with, as most calibrations were generated using relative techniques. With the introduction of ITRF2008 and IGS08 (actually IGS05 but this frame was never implemented by NGS), a completely new absolute calibration technique was used to generate antenna calibrations. Furthermore, since the absolute antenna calibrations also include calibrations for satellite antennas as well as ground antennas, they are revised periodically and are defined for a specific reference frame. NGS has updated its antenna calibration page to reflect the new absolute antenna calibrations that are associated with IGS08, NAD83(2011, MA11, PA11), namely the IGS08 absolute antenna calibrations, however to continue providing access to older reference frames the set of relative antenna calibrations is also still available. The absolute antenna calibrations may differ from corresponding relative calibrations up to several centimeters so users should ensure they are using the appropriate set of calibration values associated with the particular reference frame that they are working in.
For more detailed information on absolute antenna calibrations, please visite: NGS Antenna Calibration page.
Velocity Fields relative to IGS08 epoch 2005.00 and NAD83(2011) epoch 2010.00
Horizontal velocities are shown as black vectors. Vertical velocities are shown as colored surface.
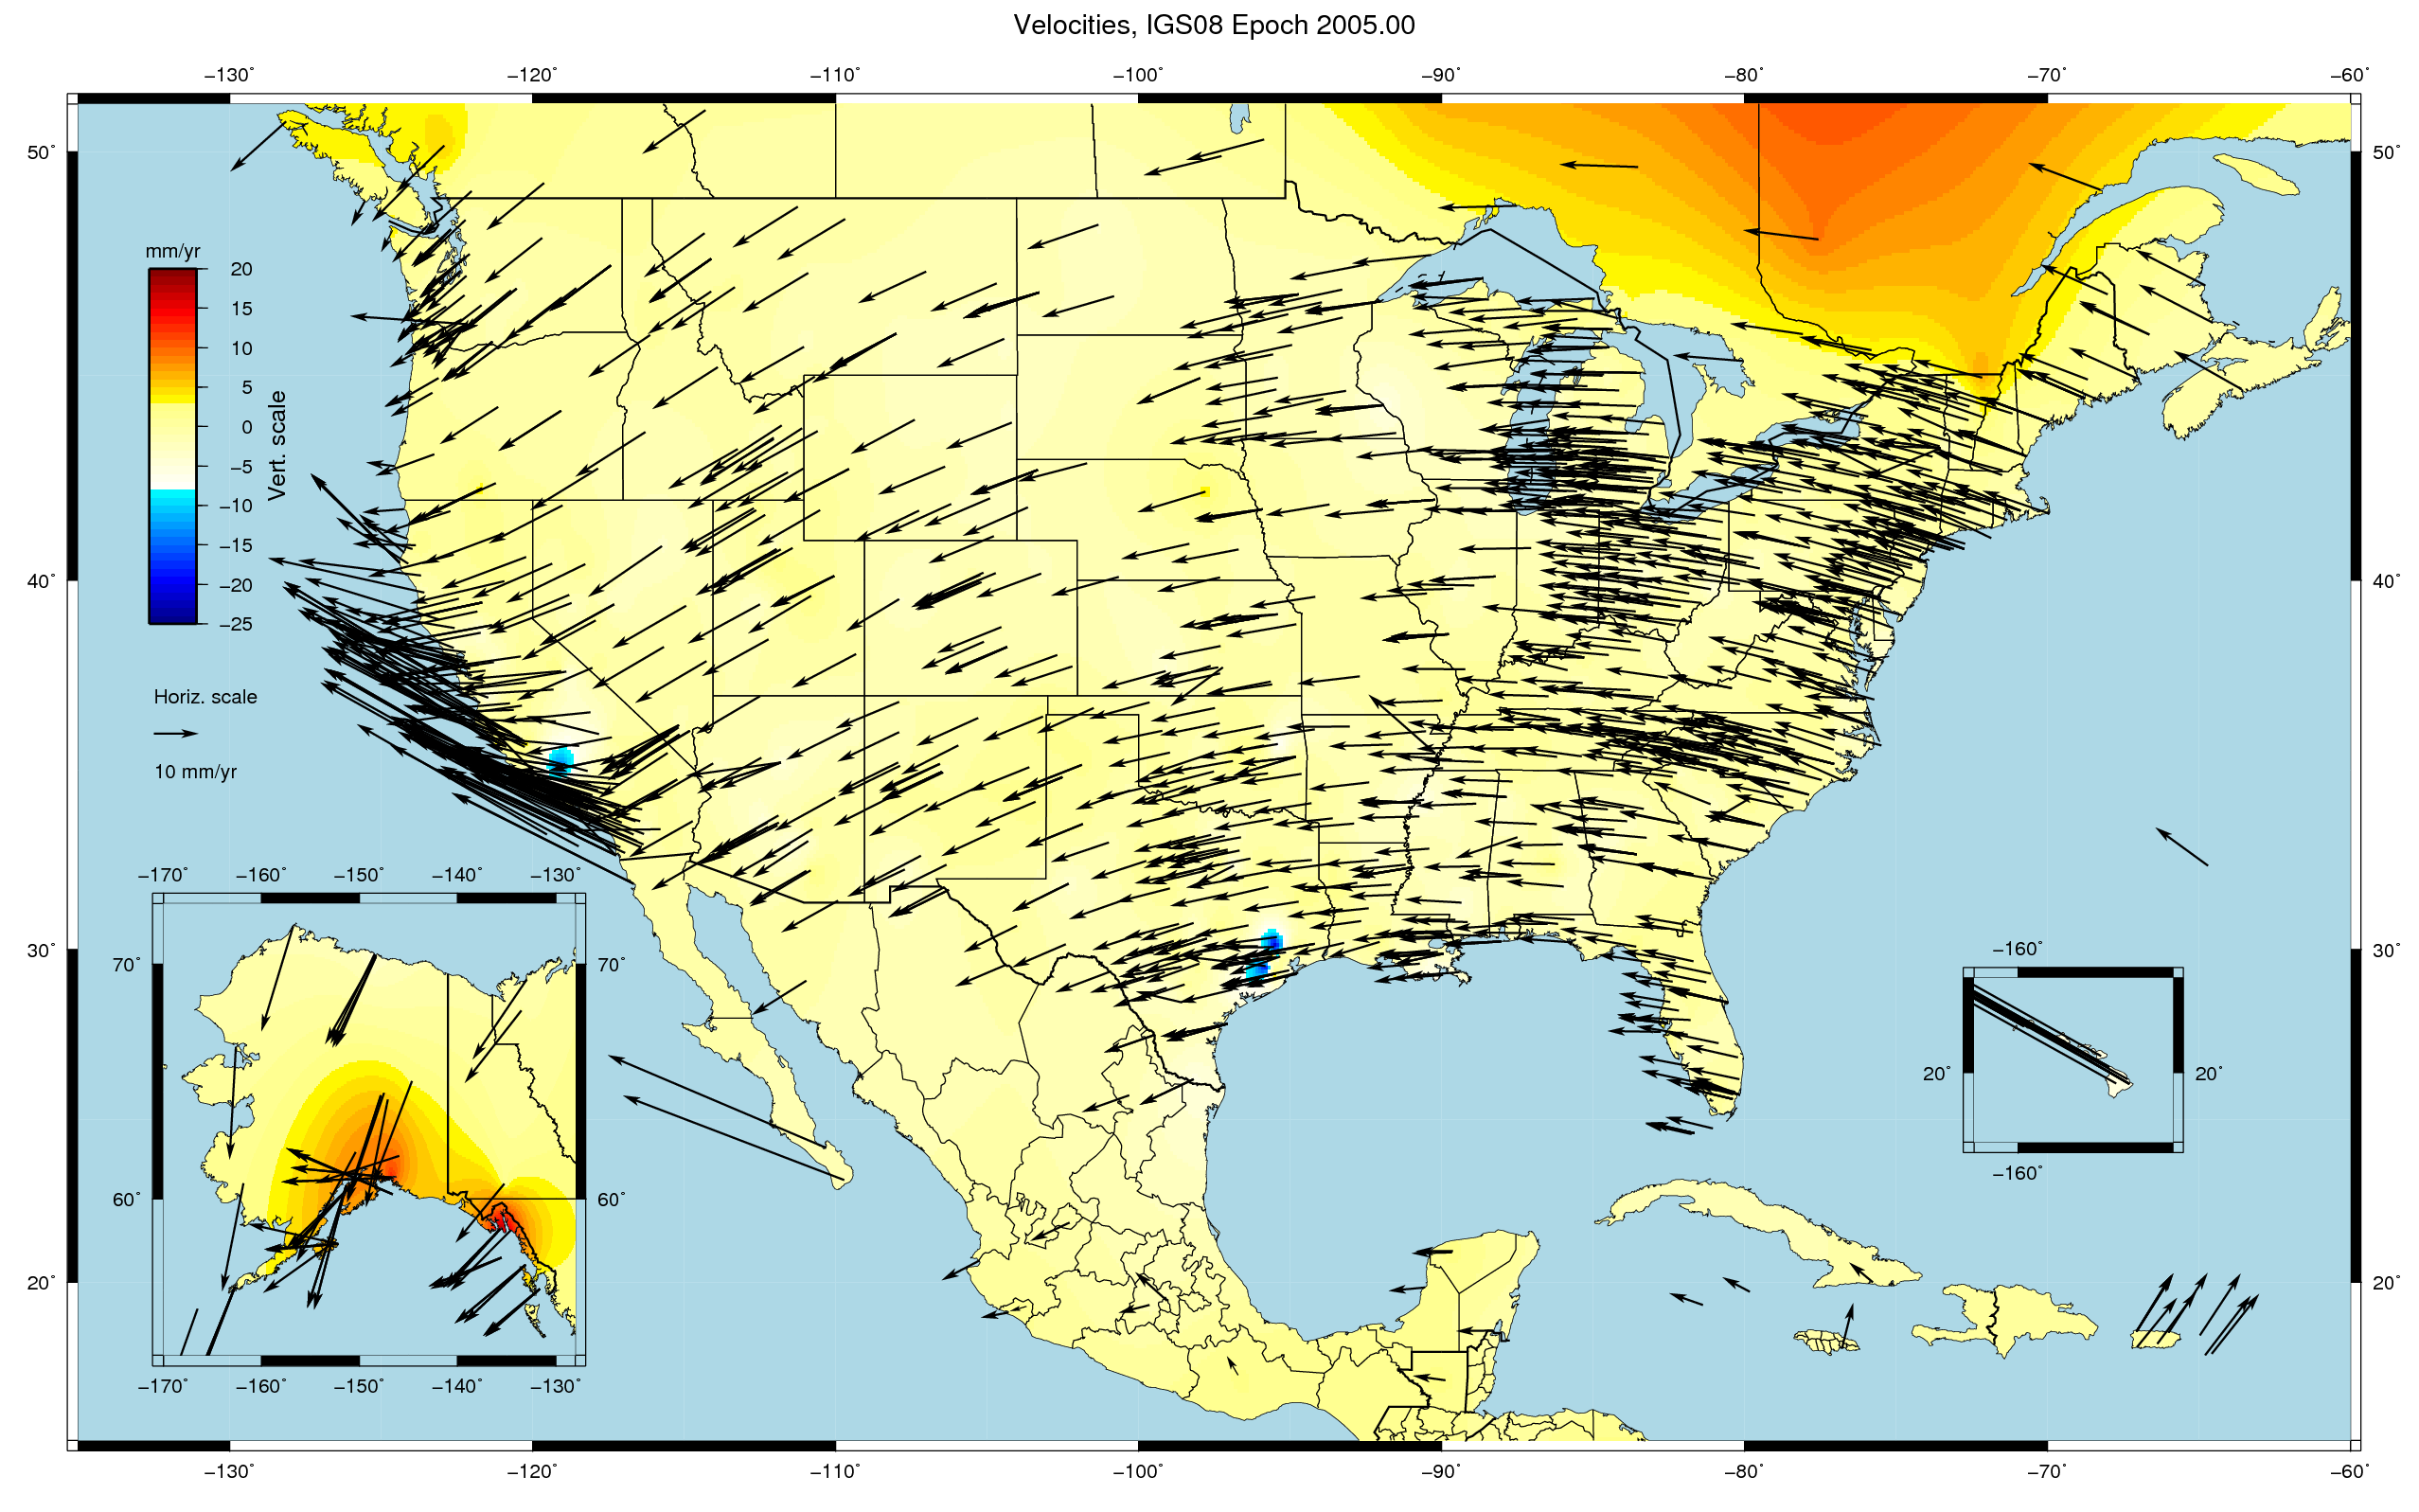
The large positive vertical velocities towards Hudson Bay reflect ongoing visco-elastic response of the earth from unloading of continental glaciers during the last glaciation.
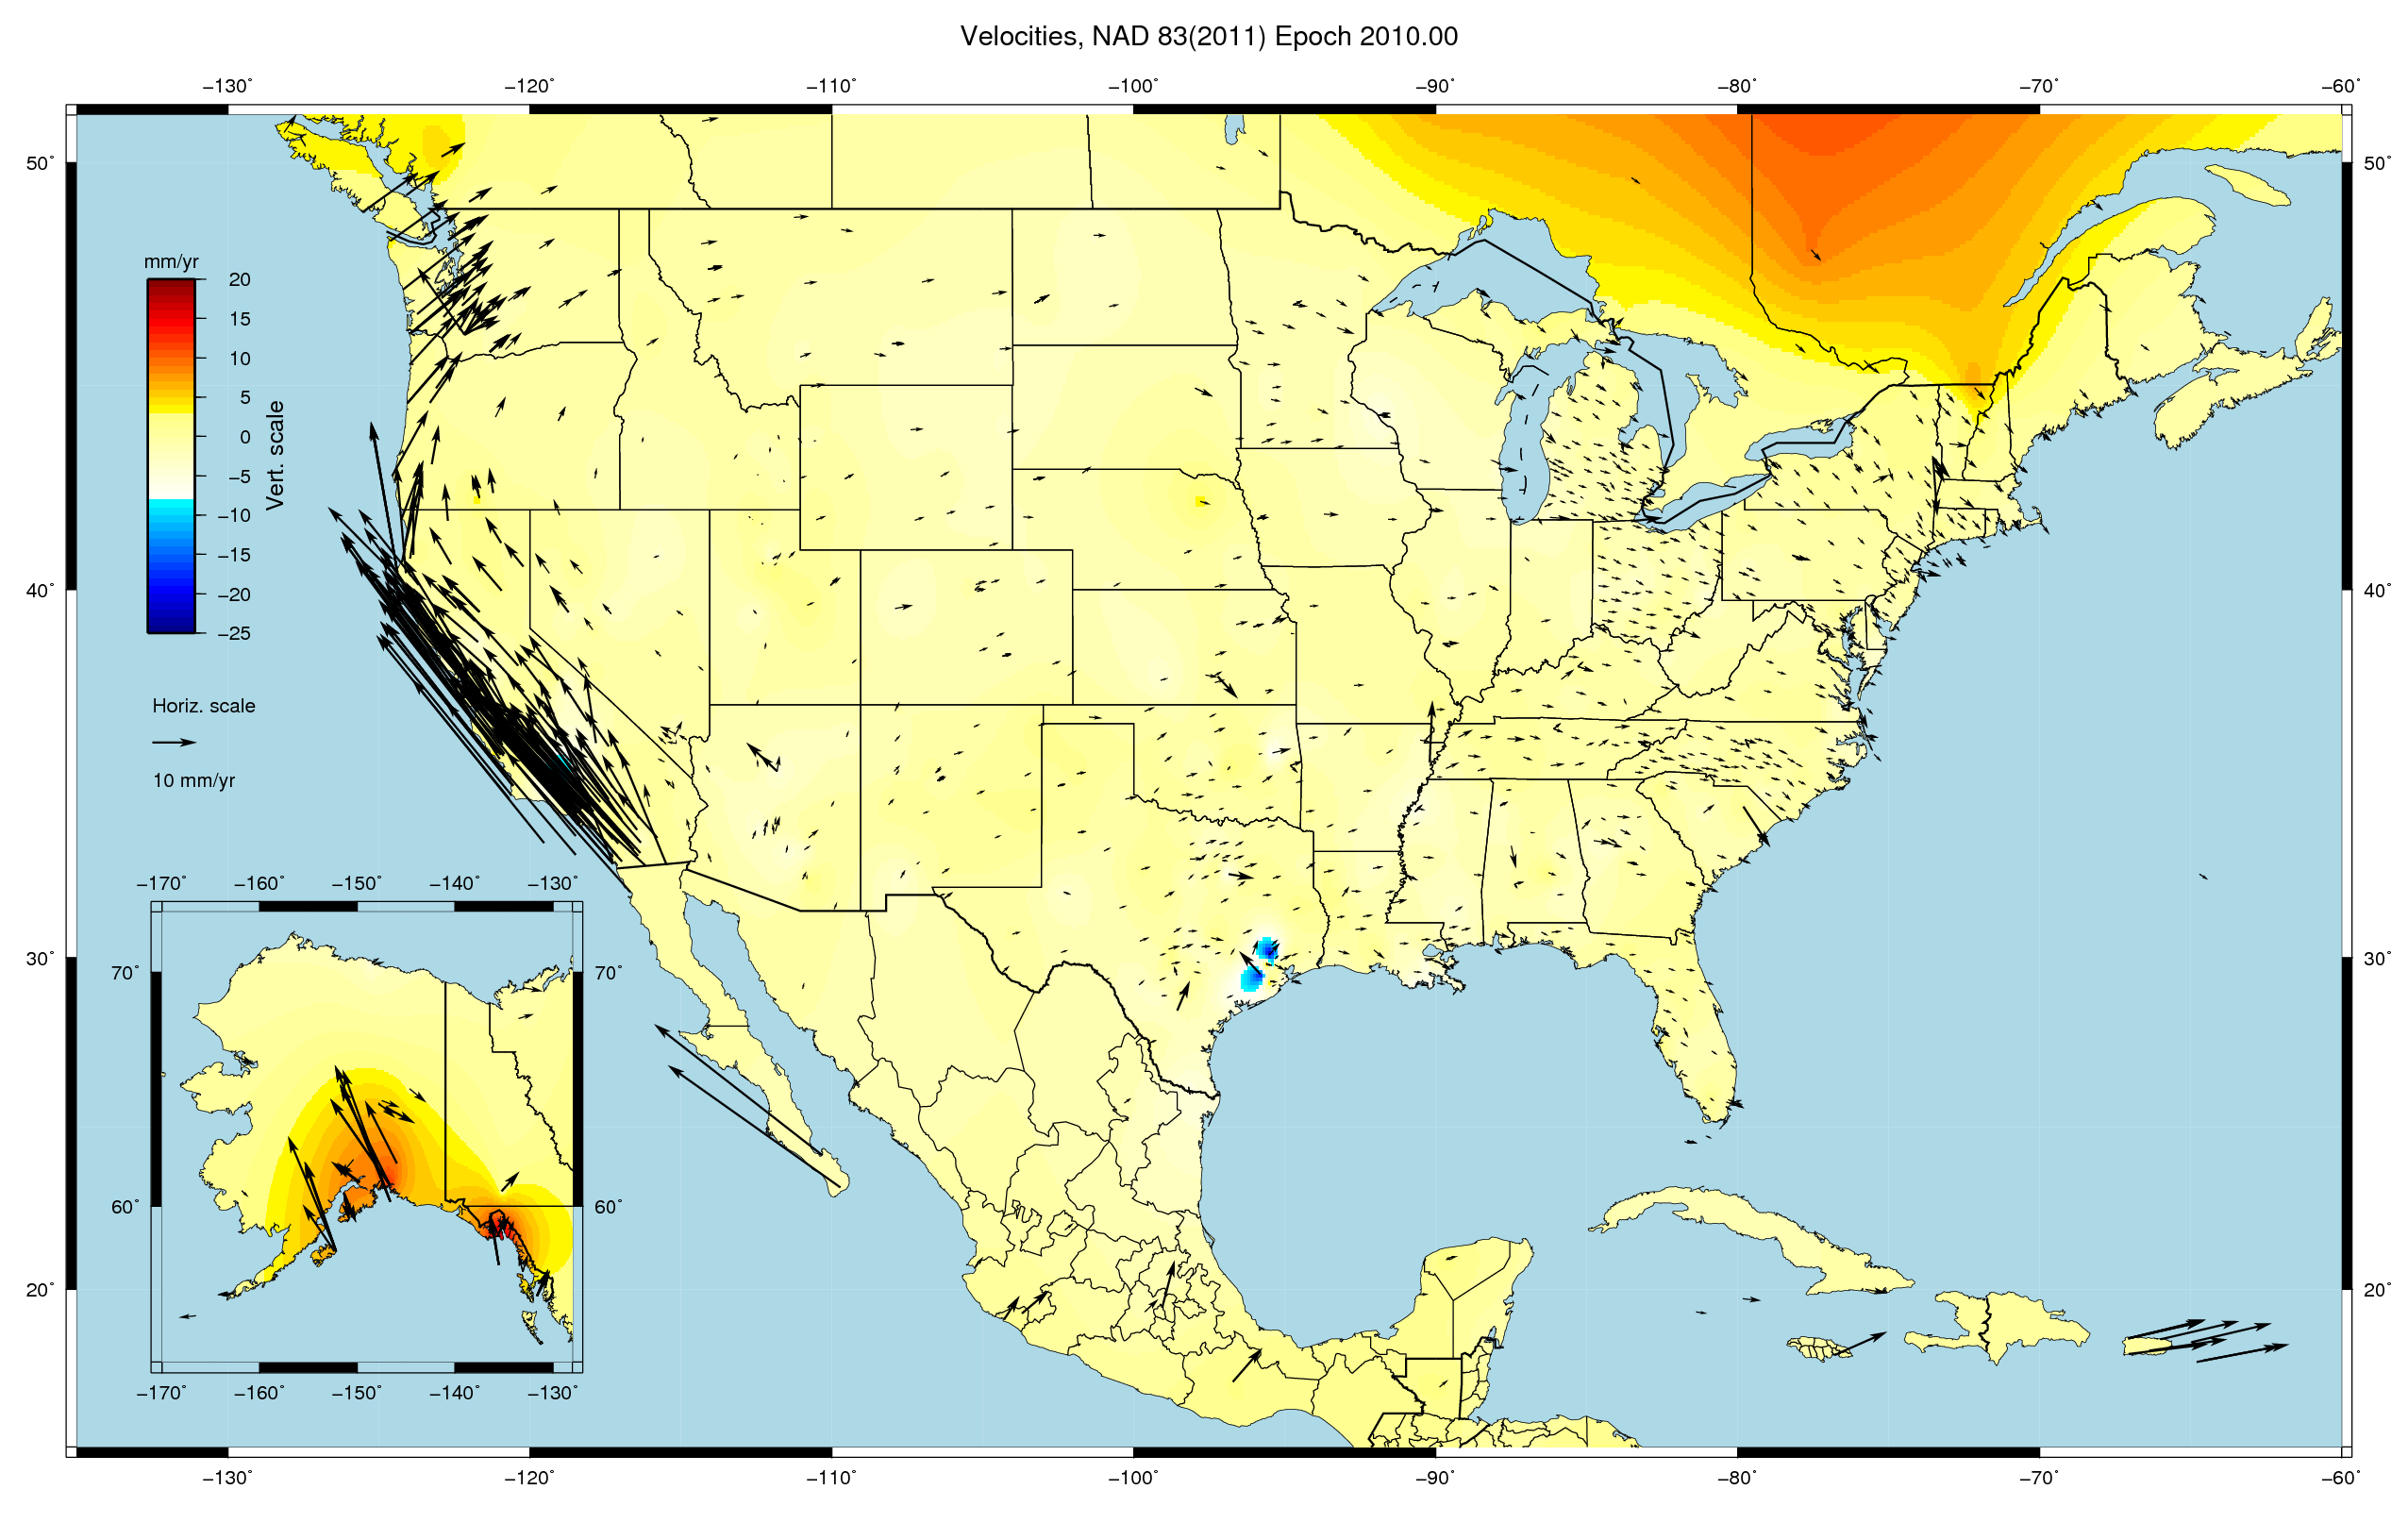
The IGS08 epoch 2005.00 solutions are then transformed to a plate-fixed NSRS consistent frame namely NAD83(2011) epoch 2010.00.
The horizontal velocities across central to eastern CONUS show a pattern indicating that not all the motion of North America has been fully removed. The vertical velocities are similar to those in Figure 3.
MYCS1 Coordinate Monitoring
Short-term Time-series Plots
NGS monitors the quality of its published coordinates through daily solutions of the CORS network. After NGS acquires data for a particular day, processing of the data is delayed by ~18hrs to obtain the IGS rapid orbits. NGS compiles short-term time series plots of these solutions that show the variation of the CORS IGS08 coordinates with respect to the published values, corrected for the effect of the published velocity. The daily residuals positions are in a local geodetic topocentric frame, North, East, and Up (vertical). Conceptually, the plots indicate how consistently each daily solution fits its' average value, which, presumably represents the outcome of ideal standard conditions. Therefore participating CORS operators, CORS team members, and outside users of CORS data sets routinely examine these plots to ensure the quality of the data they provide, distribute and use.
To better illustrate the short-term plots consider the example time-series for station CORB (Corbin, VA) on the right. This plot shows the x-axis in day-of-year (ordinal days) for the previous 90-days and the y-axis in cm in the North, East, and Up components. The horizontal (red) broken line represents the published IGS08 values for the particular component, with a green shaded area corresponding to the accuracy that the published coordinates are given, 2cm in the North and East and 4cm in the Up component (For the criteria used to republishing CORS coordinates go here). At the top of the plot is the mean (bias) and 1 sigma standard deviation for each of the three components North, East, and Up (vertical) for the data that is plotted. Each individual point is shown with its corresponding 1 sigma error bar.
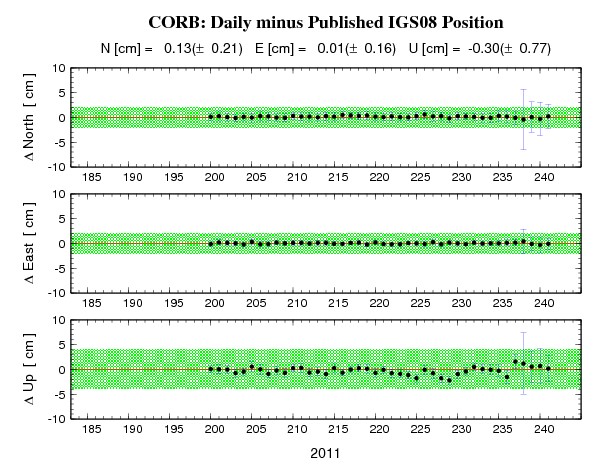 CORB (Corbin,VA) short-term time-series plot
An abrupt change in a station's position often indicates an antenna change, most commonly due to an antenna being replaced or displaced by natural phenomena (e.g. earthquakes, hurricanes). However other equipment changes such as receiver upgrade, firmware update, or environment changes e.g. new construction may also result in changes. More gradual drifts may indicate an error in the published velocity. This is common for newer stations which have modeled velocities (see Continuously Operating Reference Station (CORS) Coordinate Update Policy [December 2011]) especially in the Up component that is always set to zero, or environmental changes such as vegetation growth.
The magnitude of the vertical and horizontal errors are not necessarily correlated, although the day-to-day scatter in latitude is usually less than the scatter in longitude, which in turn is usally less than the scatter in height. Large residuals are generally correlated with less than 24hrs of data, but may also reflect unmodeled conditions at the observing stations, for example high humidity, passing storm fronts, ionospheric activity, local multipath, etc. The largest uncertainties are in the vertical (up) component and are consistent with the difficulty in modeling the atmospheric refraction (troposphere and ionosphere) and the physical impediment of collecting GPS observations below the horizon.
Long-term Time-series Plots
Long-term plots created from our stacked/MYCS1 solution are also available. The plots show weekly residual (velocity removed) positions (green dots) for all the data analyzed for a particular station. These long-term time-series show the common annual and semi-annual variation and indicate in magenta lines discontinuities that have been detected. The discontinuities may reflect equipment or environmental changes or a shift due to an earthquake. The amount of displacement/offset has been removed from the plots.
Coordinates and Velocities of the Antenna Reference Point (ARP) of All Processed Stations
Below are text files contain coordinates and velocities of the ARP of NCN stations processed in MYCS2. In which:
- Computed files contain stations, each of which provides equal or more than 2.5 years of solutions in our MYCS2, and provides at least 130 weekly solutions.
- Modeled file contain stations, each has operated for less 2.5yrs and/or provided less than 130 weekly solutions in our MYCS2. New NCN stations are included in these files.
In general, each file is a CSV file (ASCII format) containing several header lines and station records. Each line being a record reffering to a specific station. Header lines contain station ID, coordinates and velocities of the ARP, country, state codes, and the current operational status in the NCN. The station operational status is either:
- Operational: currently providing data,
- Non-Operational: has not provided data for at least 30 consecutive days,
- Decommissioned: has stopped operating permanently or was removed from NCN,
- IGS_not_CORS: IGS stations, for which NGS does not store data on its servers.
| Computed | Modeled | |||
|---|---|---|---|---|
| Cartesian | Geodetic | Cartesian | Geodetic | |
| IGS08 epoch 2005.00 All processed stations |
Download | Download | Download | Download |
| NAD83(2011) Stations in CONUS,Alaska, Puerto Rico, U.S. Virgin Islands |
Download | Download | Download | Download |
| NAD83(PA11) Stations in U.S. islands on the Pacific plate |
Download | Download | Download | Download |
| NAD83(MA11) Stations in U.S. islands on the Mariana plate |
Download | Download | Download | Download |
HTDP Transformation Parameters Used in Converting Coordinates from IGS08 epoch 2005.00 to NAD83(2011,MA11,PA11) epoch 2010.00
For historical Helmert transformation parameters used at NGS, visit Helmert Transformation Parameters page.
The NGS utility Horizontal Time-Dependent Positioning (HTDP) uses the following Helmert parameters along with crustal motion models to transform between IGS08 epoch 2005.00 and the three NAD83 reference frames. Because crustal motion models are part of the transformation process, using the Helmert parameters by themselves will not yield correct results if the input and output epochs are not the same. For example, these parameters alone cannot correctly transform to NAD83 at epoch 2010.00 if the input IGS08 coordinates are at any epoch other than 2005.00.
| Parameters t0 = 1997.0 |
Definition | Unit | From IGS08 epoch 2005.00 To | ||
|---|---|---|---|---|---|
| NAD83(2011) | NAD83(PA11) | NAD83(MA11) | |||
| Tx(t0) | x-translation | meters | 0.99343 | 0.9080 | 0.9080 |
| Ty(t0) | y-translation | meters | -1.90331 | -2.0161 | -2.0161 |
| Tz(t0) | z-translation | meters | -0.52655 | -0.5653 | -0.5653 |
| εx(t0) | x-rotation | mas | 25.91467 | 27.741 | 28.971 |
| εy(t0) | y-rotation | mas | 9.42645 | 13.469 | 10.420 |
| εz(t0) | z-rotation | mas | 11.59935 | 2.712 | 8.928 |
| s(t0) | scale | ppb | 1.71504 | 1.10 | 1.10 |
| T'x(t0) | x-translation rate | meters/year | 0.00079 | 0.0001 | 0.0001 |
| T'y(t0) | y-translation rate | meters/year | -0.00060 | 0.0001 | -0.0001 |
| T'z(t0) | z-translation rate | meters/year | -0.00134 | -0.0018 | -0.0018 |
| ε'x(t0) | x-rotation rate | mas/year | 0.06667 | -0.384 | -0.020 |
| ε'y(t0) | y-rotation rate | mas/year | -0.75744 | 1.007 | 0.105 |
| ε'z(t0) | z-rotation rate | mas/year | -0.05133 | -2.186 | -0.347 |
| s'(t0) | scale rate | ppb/year | -0.10201 | 0.08 | 0.08 |
|
where:
|
|||||
Equations Used in Converting Coordinates from IGS08 epoch 2005.00 to NAD83(2011,MA11,PA11) epoch 2010.00
The equations given below serve to transform IGS08 positional coordinates (xIGS08, yIGS08, zIGS08) whose epoch date is at time t to NAD83 positional coordinates (xNAD83,yNAD83, zNAD83) for this same epoch date. Positional coordinates for a different epoch date (and for a particular reference frame) can only be obtained by knowing the velocity (time rate of change) of the point in this reference frame. HTDP includes models that estimate these velocities, allowing transformation of coordinates at different epochs and between several commonly used reference frames.
| xNAD83 | = | Tx(t) | + | [1 + s(t)] · xIGS08 | + | εz(t) · yIGS08 | - | εy(t) · zIGS08 |
| yNAD83 | = | Ty(t) | - | εz(t) · xIGS08 | + | [1 + s(t)] · yIGS08 | + | εx(t) · zIGS08 |
| zNAD83 | = | Tz(t) | + | εy(t) · xIGS08 | - | εx(t) · yIGS08 | + | [1 + s(t)] · zIGS08 |
where:
|
||||||||
