12.6. Analyzing Network Adjustment Results
Analyzing the results depends somewhat where one is in the adjustment process. It is helpful to understand that the Processing Report, Processing Log, and individual user mark pages are all providing the same adjustment results, but displayed in various ways to give the user multiple options for analysis.
12.6.1. Processing Report (*.txt file)
The Processing Report provides a summary of the adjustment. It is included for all network adjustments. Near the top of the report, verify that the standard error of unit weight and the number of marks constrained are correct:
NGS DEV OPUS-Projects 5.1 NETWORK ADJUSTMENT REPORT
FOR network-final-horizontal-free
FROM PROJECT Golden Point Test Survey (golden7 copy).
SELECTED REPORTS ARE ATTACHED TO THIS EMAIL. ALL REPORTS ARE
AVAILABLE THROUGH THE PROJECT'S WEB PAGE FOR THIS SOLUTION.


                  ABBREVIATED SUMMARY
SUBMITTED BY:                  daniel.gillins
SOLUTION FILE NAME:            network-final-horizontal-free.sum
SOLUTION SOFTWARE:             ADJUST(6.4.3)
SOLUTION DATE:                 2022-06-28T08:49:56 UTC
STANDARD ERROR OF UNIT WEIGHT: 1.002
TOTAL NUMBER OF VECTORS:       88
TOTAL NUMBER OF MARKS:         24
CONSTRAINED MARKS:             1 HORIZONTAL, 0 VERTICAL
umbc N39:15:24.36082 W076:42:41.46870   65.940m        NAD_83(2011) @ 2010.0000
umbc         0.17cm           0.20cm     0.84cm        NEU SIGMAS

START TIME:                    2018-02-21T00:00:00 GPS
STOP TIME:                     2018-02-23T23:59:30 GPS

STANDARD DEVIATION SCALARS:    2 SOURCES
1) Trimble RTK   HORIZONTAL: 1.496 UP: 1.485
2) DEV OP 5.1    HORIZONTAL: 9.941 UP: 3.725

SESSION PROCESSING INCLUDED
===========================
FREQUENCY:                     L1-ONLY TO ION-FREE [BY BASELINE LENGTH]
OBSERVATION INTERVAL:          30 s
ELEVATION CUTOFF:              15 deg
TROPO INTERVAL:                7200 s [PIECEWISE LINEAR PARAMETERIZATION]
DD CORRELATIONS:               ON
The report will also show if there are any marks with only one set of observations (typically called a “no check” mark, when the mark does not appear in more than one session; Fig. 12.10).

Fig. 12.10 Sample network solution processing report showing a “no check” mark
Further down in the Processing Report are tables listing coordinate shifts (Fig. 12.11). The shifts compare coordinates from the current adjustment to one of the following, according to the particular adjustment being run:
A priori coordinate: Preliminary Adjustment
Coordinates from previous adjustment: HF, HC, VF, VC
Published coordinates: HC, VC
The table name describes the shift being shown. The values in parentheses are the uncertainties of the adjusted coordinates. Although these uncertainties are likely optimistic, they are still useful for assessing consistency and overall quality. The shifts themselves are related to the constraint weights set in the user preferences: “loose” constraint weights will allow larger shifts than “tight” constraints weights.
The table itself looks similar across each of the sequential adjustments, regardless of which shifts are being computed. Note that coordinate shifts are given in other adjustment output, and sometimes they refer to separate comparisons. Explanations of what all the shifts represent are given in their respective subsections below.
Regardless of which adjustment the user is running, a well-fitting adjustment results in relatively small shifts, typically 2 cm horizontal, and 4 cm vertical.
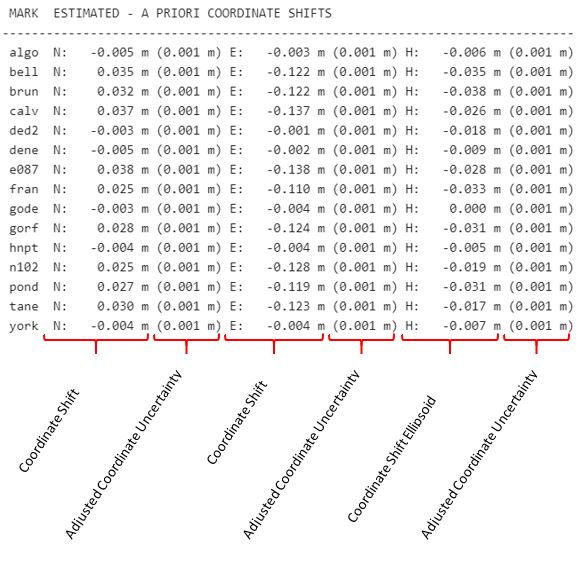
Fig. 12.11 The explanation of a solution processing report showing “MARK ESTIMATED - A PRIORI COORDINATE SHIFTS”
Below the coordinate shifts, the unconstrained marks are then shown in an OPUS-like solution report format, as shown in Fig. 12.12.

Fig. 12.12 Network solution processing report showing the coordinates of unconstrained marks
The constrained marks are shown in a similar format, with the addition of shifts between the output adjustment and the input adjustment (shown in Fig. 12.13, below).

Fig. 12.13 Network solution processing report showing coordinates of a constrained mark and the coordinate shifts between computed and published coordinates
12.6.2. Processing Log (*.sum file)
The contents of the Processing Log will differ somewhat between the Preliminary (GPSCOM) and the subsequent network adjustments (ADJUST). With GPSCOM, the Processing Log and the Processing Report contain similar information (so there is no need to review both). However, for adjustments run with ADJUST (HF, HC, VF, VC), the Processing Log contains important information not contained in the Processing Report (historically referred to as “ADJUST Output”):
* List of constraints and options for the adjustment (known as the adjustment option file for ADJUST, called the “AFILE”) * Options chosen in the ADJUST program are explained * List of constraints used in the adjustment * Observational Summary shows the number of vectors per mark and whether the station is fully constrained * Commencing Adjustment shows the start of the iterative adjustment * Adjustment Converged shows the final statistics including variance factors * Blue-Book Statistics give statistics of the input files * Normalized Residuals * Residual Statistics * Adjusted Positions * Coordinate shifts: Comparison Of Adjusted and Constrained Coordinates and Heights (mostly applies to HC Adjustment). For adjustments with multiple constraints, this is the only location to review the shifts between adjusted and published coordinates. * Local and Network Accuracies
RESIDUAL STATISTICS is a section of the output that provides multiple listings of the 20 greatest residuals listed by observation number. Additionally, it provides tables which gives a quick glimpse into the quality of the adjustment by providing a max/min list of residuals written in scientific notation for dX, dY, dZ (Earth-Centered, Earth-Fixed coordinates), dN (north), dE (east), dL (horizontal length), and dU (up, or vertical), with the corresponding observation number given to the right of each residual.
Large residuals are indicative of a problem. Particularly if they involve stations that also had large shifts as noted in the Processing Report.
In the example shown above, the largest residual in the project is in the absolute value in the “up” component at 5.1 cm on the observation number 141. Going to that observation in the NORMALIZED RESIDUALS section of the Processing Log, you will find the session number (see below):
More information about which observation may have caused a large residual (above) may be confirmed with COMPVECS and Preplt (see below).
12.6.3. COMPVECS Output
COMPVECS output, available from the Horizontal Free adjustment, lists all replicate vectors in the project. Differences are computed against the first (initial) vector. If large residuals are found in the free adjustment Processing Log, this output can help isolate the errant vector. Specifics on how to read and interpret the output is provided in Section 12.7.2.2.
12.6.4. PREPLT2
PrePlt2, available as an output of ADJUST (HF, HC, VF, VC), is another tool that provides a list of residuals (DN, DE, DU) and baseline lengths pulled from the Processing Log, an example is provided in Fig. 12.14. The output can be easily imported into a spreadsheet or other file type to enable sorting on the size of the residuals in the north, east, and up components. Look for any residuals larger than +/- 0.020m horizontally or +/- 0.040m vertically (note that the residuals are expressed in meters, not centimeters).

Fig. 12.14 Sample output from the PREPLT2 file
12.6.5. CHKOBS
CHKOBS is a program that checks for structural issues with the project data - required for submitting your project to NGS (only available with Project Tracking ID), and can be ignored if you have no intent to publish. The program is run with the Horizontal Free adjustment, as well as at the final step of submitting the project to NGS. Errors and warnings listed in the CHKOBS output file need to be reviewed. If missing data are reported, use the user mark pages to find and fill in the missing data. Any remaining errors or warnings must be written up and explained in the project report.
12.6.6. OBSCHK
The OBSCHK program checks the occupation and the vector data -also required for submitting your project to NGS (only available with Project Tracking ID). The program is run with the Horizontal Free adjustment and upon submission to NGS. Any errors or warnings listed in the OBSCHK output file must be reconciled. If errors exist of which you are unsure how to fix please contact the Bluebook Team.