7.1. The Project Manager’s Web Page
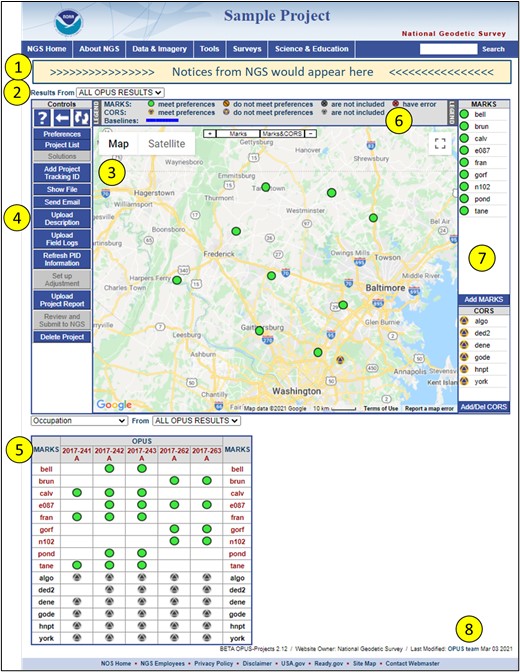
Fig. 7.1 The Project Manager’s web page
Elements numbered in Fig. 7.1 are explained in the corresponding subsections below.
7.1.1. Notices
Notices about OP and, very rarely, a message specific to a project (no other project will see these specific messages) may appear at the top of the Managers, Session, Mark, GVX Report, and GVX Baseline web pages, as shown in Fig. 7.2. An email link to the OPUS Projects Team will appear with any notices and messages so that follow-up questions can be asked if needed.
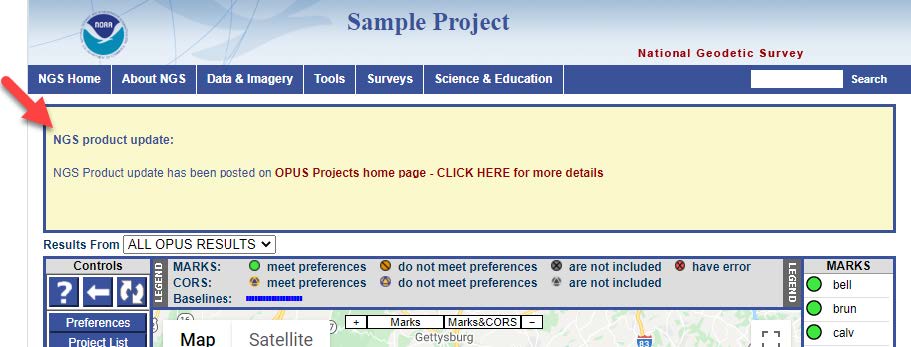
Fig. 7.2 The Notices banner on the OPUS Projects Manager’s Page
7.1.2. Results Selection Menu
A dropdown menu can be found below the banner and any notices on the webpage, as shown in Fig. 7.3. This menu allows users to choose from a list of available solution results, which are broadly categorized into four types: network adjustment, session solutions, OPUS solutions, and GVX vectors. As work in a project progresses, displaying all result types at once can lead to confusion. Therefore, this menu provides a simple “filter” to help emphasize the results of most interest.
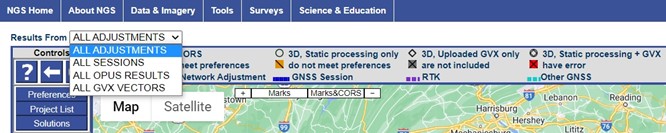
Fig. 7.3 Drop-down menu location for displaying results on the Manger’s Page
7.1.3. Project Map
The Managers, Session and Marks web pages are built around a Google Map Services™ interactive map to help orient users within the project and its geographic region. As project members upload observation data to the project through OPUS, icons representing the user marks will appear on the map. CORSs used by OPUS during its processing of the project data will be added to the project at upload or can be added to the project later. Different icons are used to reflect a user marks status in the project.
Caution
All marks observed are displayed on the map, as well as all CORSs used in the individual OPUS solutions. This does not mean that all marks were observed in all sessions, nor that all CORSs were available or are automatically selected in all sessions.
Within the map display to the upper-left, there are typical zoom controls (+/-) and controls to zoom specifically to the project’s ‘Marks’ or ‘Marks & CORS’, as shown in Fig. 7.4.
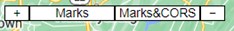
Fig. 7.4 Map zooming toggles
In addition, the upper-left corner of the map allows users to set the map background as either Satellite (which displays satellite imagery if available) or Map (which shows towns, streets, and highways), as shown in Fig. 7.5. The user can click and drag (pan) the map to view nearby areas.

Fig. 7.5 Map background options
Fig. 7.6 shows that when you hover the cursor over a user mark icon, the icon will become lighten in color and the marks ID will be displayed.
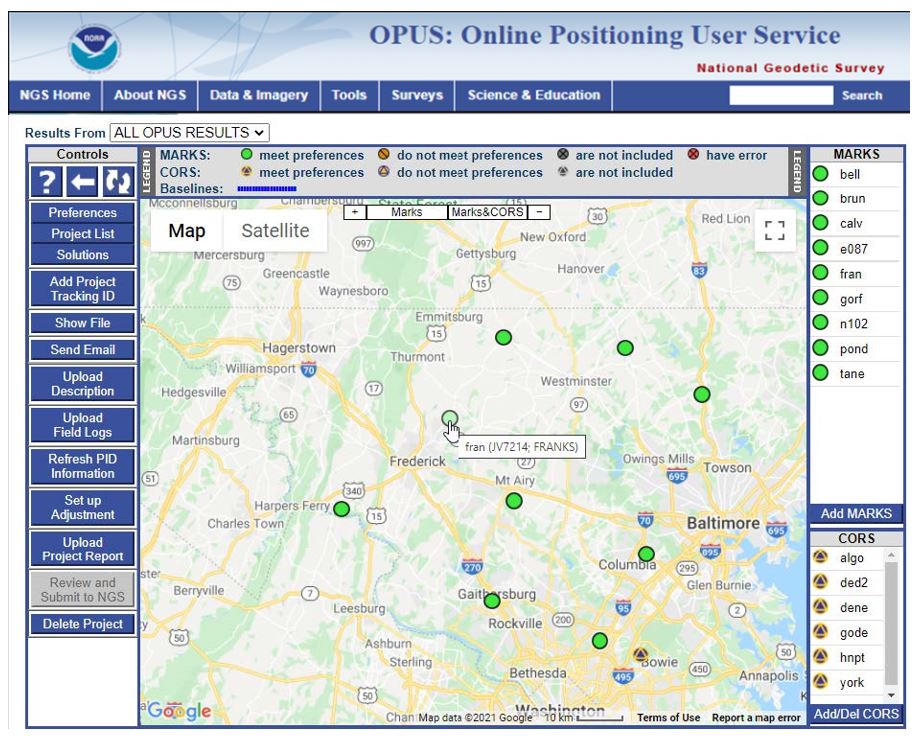
Fig. 7.6 Mark ID shown by hovering over mark
Clicking a mark icon on the map or from the MARKS list will display an information “bubble” containing information about the data files associated with that particular mark, as shown in Fig. 7.7.
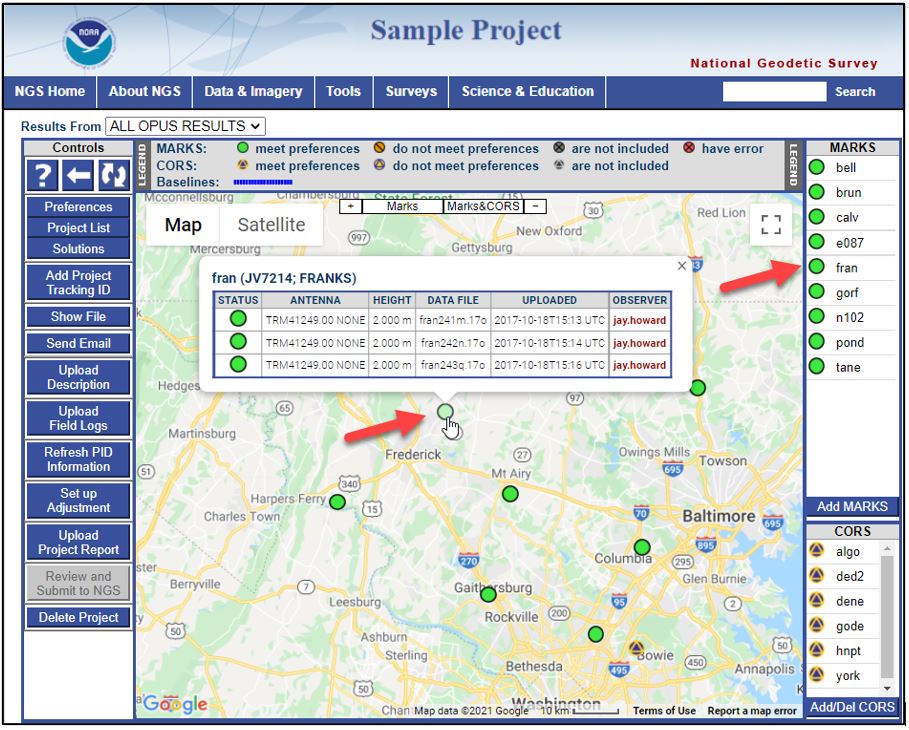
Fig. 7.7 Mark data information shown when clicking on a user mark icon
In Fig. 7.7, the mark ID is given at the top of the information bubble. If the mark is a user mark (not a CORS), the ID acts as a convenience link to navigate to the summary web page of that mark. The information bubble also contains a table listing all the uploaded data files associated with the mark. If there is more than one file for a mark, it means that data observed at the mark was from multiple sessions. Additionally, each row in the table shows the antenna type and ARP height associated with each file. The project team member who uploaded the files is referred to as the ‘OBSERVER’, and their name is a convenience link that you can use to send them an email message.
Similarly, when you hover the cursor over a CORS icon, its four-character CORS ID, Permanent Identifier (PID), and designation will appear, as shown in Fig. 7.8.
list will display an information “bubble” that contains detailed information about the CORS such as antenna type, antenna height, and data file, as shown in Fig. 7.9. Data availability for each of the sessions identified in the project will be displayed under “STATUS”.

Fig. 7.8 CORS ID shown when hovering over a CORS
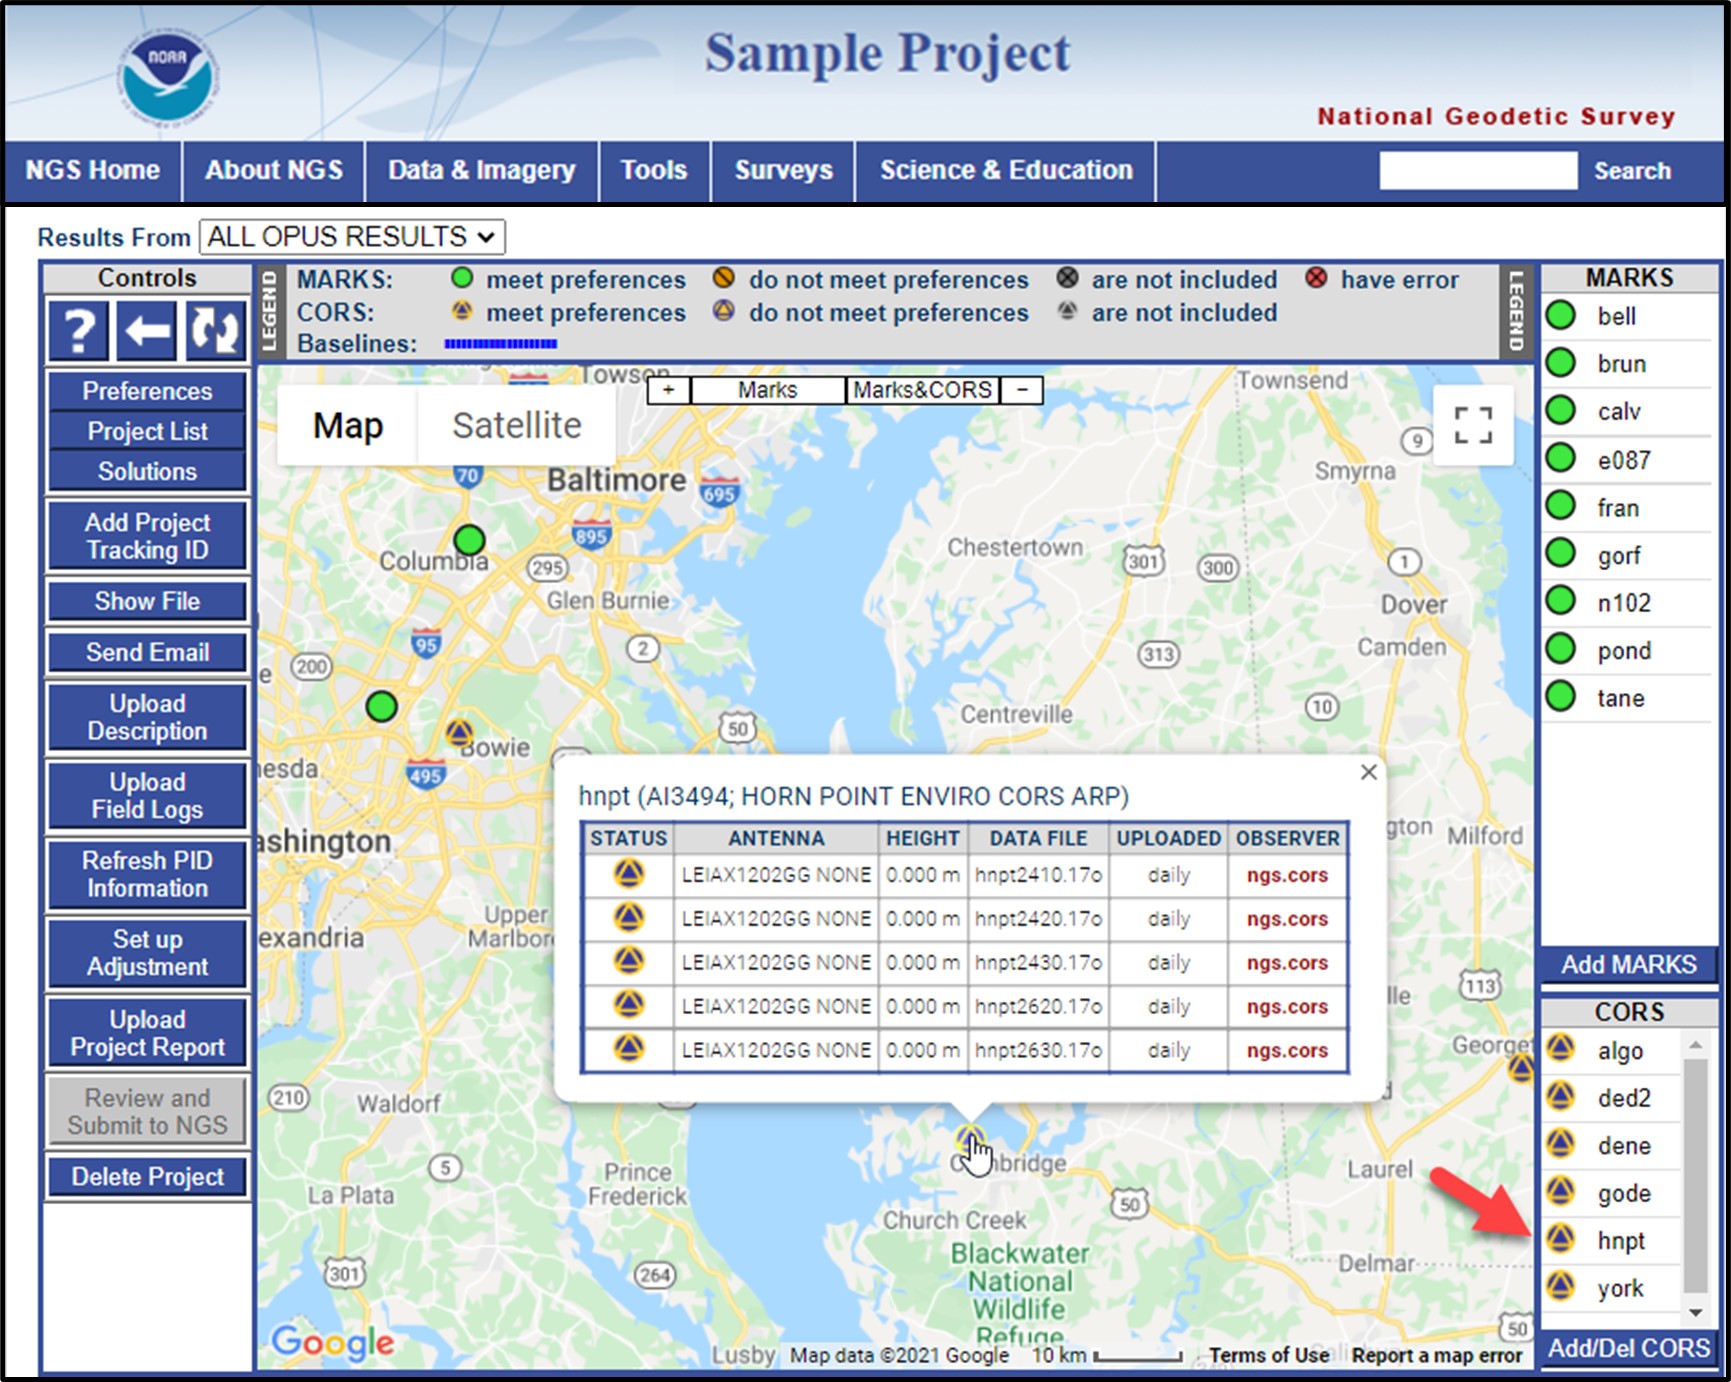
Fig. 7.9 CORS data information shown when clicking on the CORS icon
7.1.4. Controls Bar
Controls for common manager tasks appear on the left side of the map and are shown in Figure Fig. 7.10.
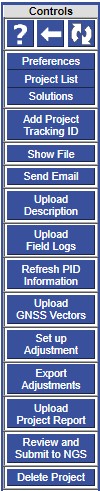
Fig. 7.10 The Controls bar
Tip
Controls differ somewhat among the different web pages available in OP. They also differ between the Manager’s Page and the Session Processing Page, and may differ according to the steps you have already accomplished.
7.1.4.1. Help, Back and Refresh
Fig. 7.11 Top page control options
Help, Back, and Refresh buttons appear at the top of the controls, as shown in Fig. 7.11. Please note that the Help button is under development, and may ultimately provide the same resource as this document. Pressing the Back will take you back to the previous web page in the browsers history. Its action is identical to the browsers back control. Clicking on the Refresh button will scan the project and reload the current page. It is recommended that you use this OP refresh button instead of the one provided by the browser.
7.1.4.2. Preferences
Fig. 7.12 Preferences button on the Controls bar
The Preferences button enables access to preferences, described in Section 4 and shown in Fig. 7.12.
7.1.4.3. Project List
Fig. 7.13 Project List button on the Controls bar
The Project List button, shown in Fig. 7.13, sends an email to the project manager listing all projects created under the managers email address. The provided information includes project IDs, keywords, and titles. This can come in very handy for recovering lost or forgotten project information.
7.1.4.4. Solutions
Fig. 7.14 Solutions button on the Controls bar
The Solutions button, shown in Fig. 7.14, opens a new window (see Fig. 7.15) enabling the manager to rename Session Solutions and Network Adjustments, as well as delete the solutions and adjustments (allowing them to be re-computed). More on Session Solutions in Section 11, and Network Adjustments in Section 12.

Fig. 7.15 Manage Solutions pop-up window
7.1.4.5. Add Project Tracking ID
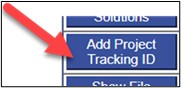
Fig. 7.16 Add Tracking ID button on the Controls bar
Clicking on the Add Project Tracking ID button, shown in Fig. 7.16, will open a separate window (example shown Figure Fig. 7.17) in which the user can input the NGS-provided Project Tracking ID(an outcome of submitting a survey project proposal to NGS). Recall that a Project Tracking ID unlocks the advanced features of OP.
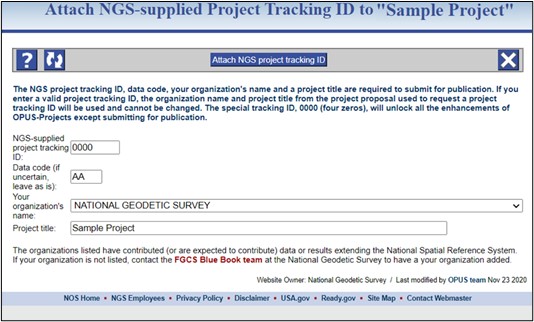
Fig. 7.17 Attach NGS Project Tracking ID pop-up window
7.1.4.6. Show File
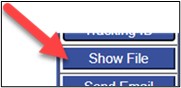
Fig. 7.18 Show File button on the Controls bar
The Show File button , shown in Fig. 7.18, reveals a pop-up window for displaying all available solution reports (example shown Fig. 7.19).
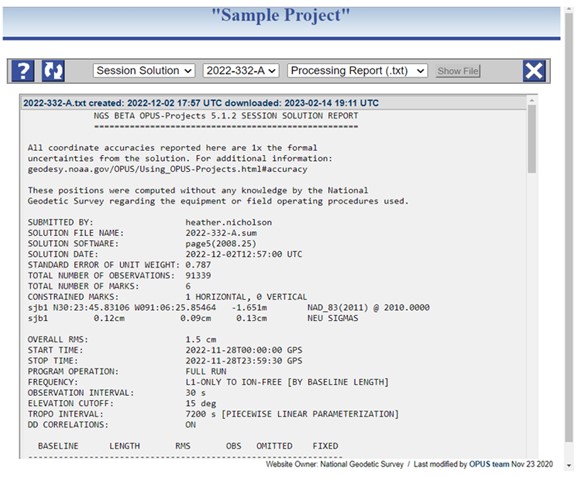
Fig. 7.19 Pop-up window showing a sample solution from a processed session
The top of the pop-up window displays standard controls, and the users can choose from a variety of available reports, including:
Individual OPUS solutions
Session processing results
Network adjustment results
GNSS Vector Exchange (GVX)
Underneath the controls is a header that shows the reports name, its creation and download (current) times. The report is then displayed below the header. Some browsers offer a print option by right-clicking (right mouse button) anywhere in the report. All browsers should allow the reports text to be copied and pasted into another file using the standard method for the operating system.
Caution
The output file names available via the “Show Files” menu can be somewhat different from the output file names received by the project manager via email. A table cross-walking the file names is provided in Section 12.
7.1.4.7. Send Email
Fig. 7.20 Send Email button on the Controls bar
The Send Email button, shown in Fig. 7.20, displays a pop-up window (as shown in Fig. 7.21) with basic controls permitting the project member viewing this page to send emails to members of the project team, including herself or himself, or the OPUS Projects team.

Fig. 7.21 Send Email Message pop-up window
Pop-up window controls appear across the top. Below these controls, the emails recipients can be selected from the project team (either Processors or All Field Members). “Field Members” are the email addresses associated with individual OPUS uploads to the project so there will always be email addresses under the “All Field Members” selection. A subject line can be added in the next text box. The emails can include available OP reports as attachments. These can be selected by using the controls next to the “Attach” box. Finally, there is an entry field for a short text message.
7.1.4.8. Upload Description

Fig. 7.22 Upload Description button on the Controls bar
Clicking on the Upload Description button, shown in Fig. 7.22, opens a pop-up window (shown in Fig. 7.23) providing information on the types of description files needed (5 in all). The user is able to navigate to the corresponding files and upload them to the project from this window. Appendix A provides a tutorial for building description files.
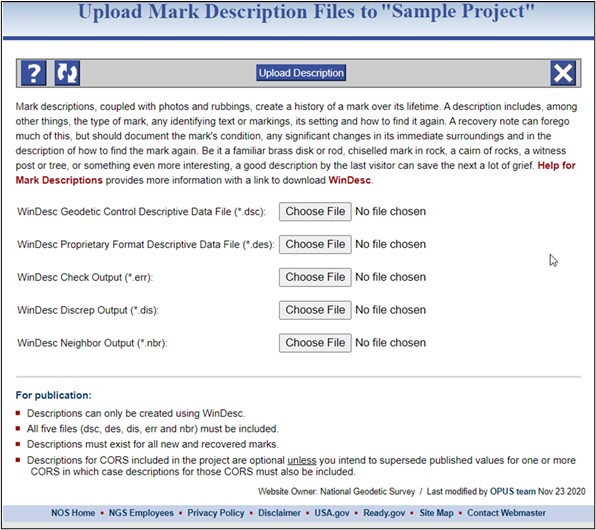
Fig. 7.23 Choose WinDesc Description Files for loading into project (pop-up window)
Note that Descriptions/Recoveries are required for all passive marks. NCN stations are not to be included in the description files. Non-NCN CORS stations that are not currently in the NGS IDB (do not have PIDs/datasheets) must be included in the description files. If known, a set date as well as a recovery date should be entered into the form using the Recovery/Fully describe a mark not in the NGSIDB.
7.1.4.9. Upload GNSS Observation Field Logs
Fig. 7.24 Upload Field Logs button on the Controls bar
Click on the Upload Field Logs button, shown in Fig. 7.24, opens a pop-up window (shown in Fig. 7.25) which allows you to select and upload your file logs as a single zip folder (recommended) or a single, concatenated PDF (*.pdf), Microsoft Word (*.doc), or ASCII (*.txt) text file. Field logs do not modify anything within the actual project, but they are required for all occupations if submitting to NGS.
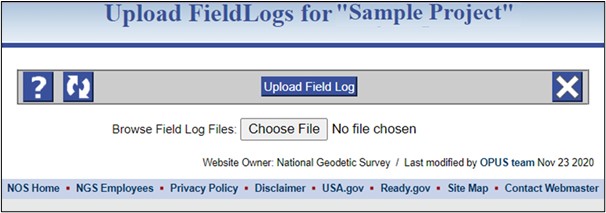
Fig. 7.25 Choose Field Log to upload pop-up window
Please refer to the following links for a sample GNSS observation field log and visibility diagram:
GNSS observation field log: https://geodesy.noaa.gov/RSD/forms/obslog.pdf
GNSS visibility diagram: https://geodesy.noaa.gov/surveys/forms/visibility.pdf
Additional field forms and information: https://geodesy.noaa.gov/surveys/forms/
Caution
Although there is no mechanism for you to see that your log files have been loaded, you will only get a response if there is a problem with the load.
Tip
It is highly recommended to upload your field logs as a single zip file with the individual field logs following the naming convention from Section 5.4.
7.1.4.10. Refresh PID Information
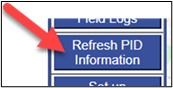
Fig. 7.26 Refresh PID Information button on the Controls bar
Permanent Identifiers, or PIDs uniquely identify marks in the NGS database. Clicking the Refresh PID Information button, as shown in Fig. 7.26, will retrieve the latest information from NGS on user marks with PIDs whose descriptions have already been entered into OP (see Fig. 7.27). If the button is pressed but there are no PIDs associated with any user marks, an error message will be displayed. If there is any differing information between the NGS database and OP (e.g. updated coordinates), the new information will replace what is in OP. This is recommended prior to session processing, to make sure you have the latest (correct) information for the PIDs in your project.
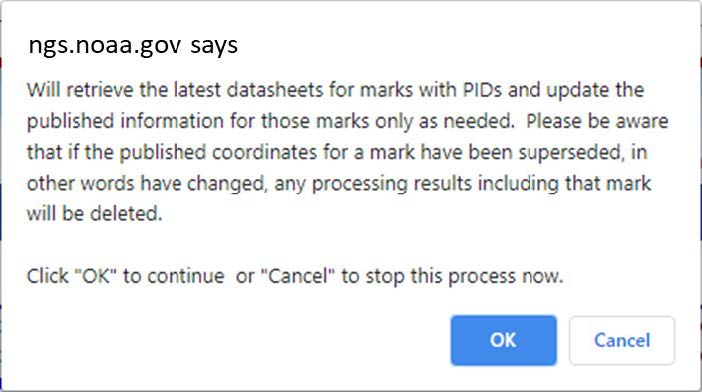
Fig. 7.27 Confirmation or Cancel PID Refresh
Caution
Refresh PID Information will only overwrite any original information loaded directly from the datasheets. It will not overwrite information supplied either by the user or OPUS.
Danger
If PID information has changed in the NGS database after the user has conducted session processing and/or adjustments, and the user then refreshed PID information, prior session processing and/or adjustments will disappear.
7.1.4.11. Upload GVX Vectors
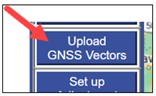
Fig. 7.28 Upload GVX Vectors button on the Controls bar
Clicking on the Upload GVX Vectors button, shown in Fig. 7.28, opens a pop-up window (shown in Fig. 7.29) that allows you to upload a GNSS Vector (.gvx) file(s).
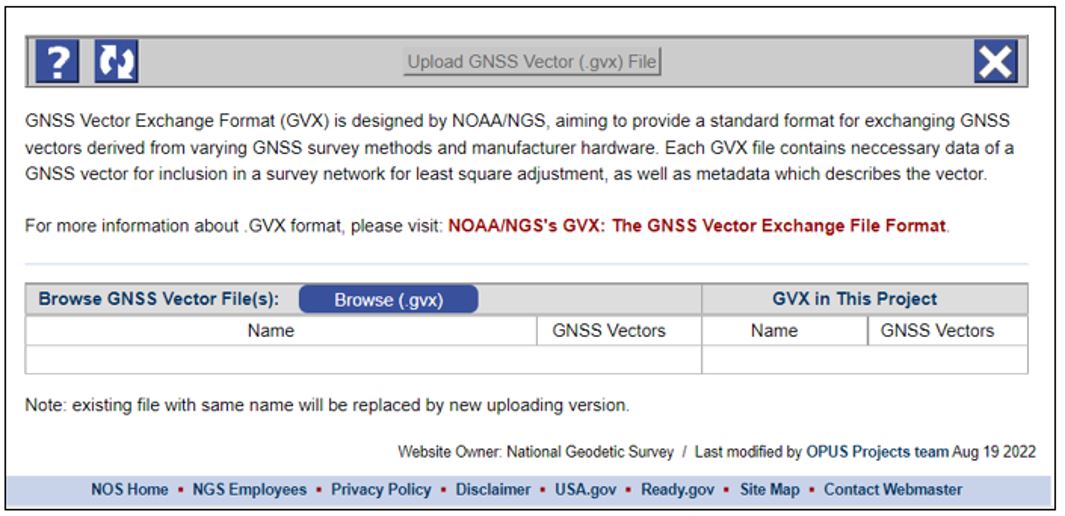
Fig. 7.29 Upload GVX Vectors pop-up window
7.1.4.12. Set up Adjustment
Fig. 7.30 Setup Adjustment button on the Controls bar
From the Managers Page, the Set up Adjustment button, shown in Fig. 7.30, will be active if at least one session in the project has already been processed (more on session processing in Section 11). Clicking on the Set up Adjustment button opens an adjustment processing window, shown in Fig. 7.31. If an NGS Project Tracking ID has been associated with the project, five consecutive adjustment steps are identified (without the Tracking ID, this part of the window is blank):
Preliminary
Horizontal free
Horizontal constrained
Vertical free
Vertical constrained
The procedures for running these adjustments are covered in Section 12. Note that the adjustments are meant to be sequential, so not all adjustments are available at any given time.

Fig. 7.31 Setup Adjustment Type, Include Available Solutions pop-up window
7.1.4.13. Upload Project Report
Fig. 7.32 Export Adjustments button on the Controls bar
Clicking on the Export Adjustments button, shown in Fig. 7.32, opens a pop-up window (shown in Fig. 7.33) that allows you to export your network solutions in several popular formats including: CSV, GeoJSON, DXF, KML, and GPKG (GeoPackage encoding standard: https://www.ogc.org/standards/geopackage).

Fig. 7.33 Export adjustments pop-up window
7.1.4.14. Upload Project Report
Fig. 7.34 Upload Project Report button on the Controls bar
The Upload Project Report button, shown in Fig. 7.34, allows the user to load a completed Project Report into the project. The report will not modify anything in the project, but it is a required input for submission to NGS.
7.1.4.15. Review and Submit to IDB
Fig. 7.35 Review and Submit to NGS button on the Controls bar
The Review and Submit to IDB button, as shown in Fig. 7.35, runs a set of programs to ensure that all required files are present and that there are no structural errors with the data files to be submitted to NGS. Specifically, the user will be provided a checklist showing the status of all required adjustment steps and uploaded files, and which of these may be missing. The programs CHKOBS, OBSCHK, and OBSDES are run, and the output provided (see Section 12 and the Glossary for more information).
7.1.4.16. Delete Project
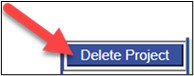
Fig. 7.36 Delete Project button on the Controls bar
Clicking the Delete Project button, shown in Fig. 7.36, will initiate a three-step process that, if completed, will delete the project from your own manager list of projects. First a confirmation message appears, as shown in Fig. 7.37.
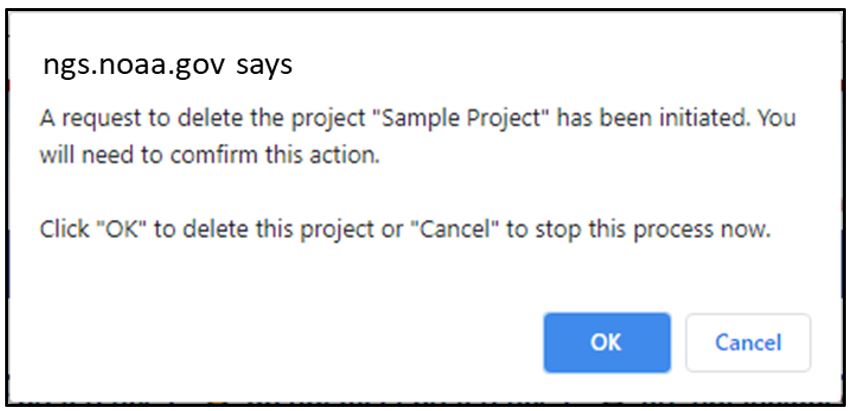
Fig. 7.37 Delete Project confirmation pop-up window
Cancel will immediately end this process without the project having been deleted.
OK will send an email to the project manager. If the email is ignored, the process is canceled without the project having been deleted. A reply to the email implies consent and the project is deleted. A confirmation email is sent to the project manager.
7.1.5. Marks and Sessions Table
The Marks and Sessions table at the lower left of the Managers Page shows the list of user marks associated with GNSS observation files that have been loaded into the Project. The default display includes which marks were observed in each of the projects sessions (“Occupations” and “All OPUS Results”), and whether the observations met the minimum quality metrics as defined in the user preferences, an example is shown in Fig. 7.38.
OP assigns static session names as follows: “yyyy-ddd-X,” where “yyyy” is the four-digit year, “ddd” is the three-digit GPS day of year, and “X” is the individual session within that day. By default, the first session is named “A.” If there are multiple sessions in the same GPS day, the next session will be named “B,” and so on. GVX files will be displayed by the file name.
Clicking on the Session ID will open the Session Page for that session.
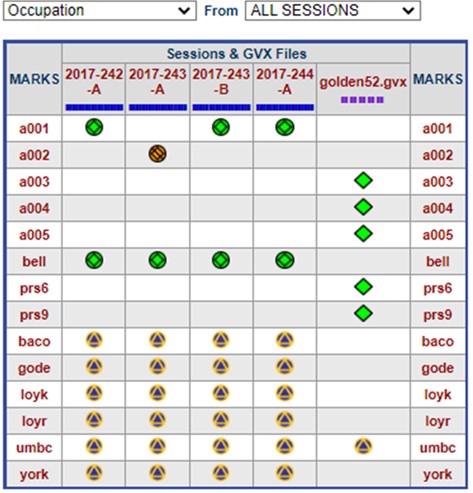
Fig. 7.38 MARKS and Sessions Table showing summary occupation data for all sessions
In addition, the user can select from a number of different displays, including “Solution Statistics,” shown below in Fig. 7.39.
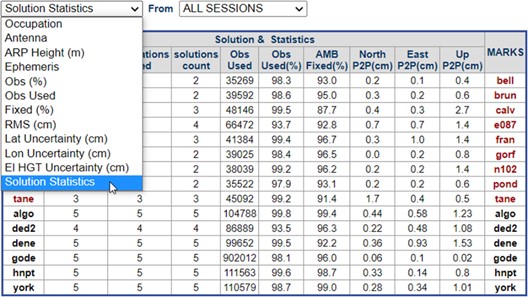
Fig. 7.39 Solution Statistics for All Sessions Table that can be displayed on the Manager’s Page
The user can also toggle between displaying the table for ALL OPUS SOLUTIONS, ALL SESSIONS, ALL GVX VECTORS, or ALL ADJUSTMENT results (once sessions have been processed, a GVX file(s) have been uploaded or an adjustment has been made).
7.1.6. Color Coding Marks, CORS and Baselines
The Managers Page displays all user marks and CORSs in the project, each of which is represented by an icon for easy identification. These icons not only indicate the type of mark, such as CORS, 3D Static processing only, or 3D Static+GVX type, but also reflect how the Quality Thresholds were met for each user mark and CORS. Fig. 7.40 illustrates the icon symbology.

Fig. 7.40 Symbology for distinguishing between user marks, CORSs, and baselines
User mark/CORS icons can be seen on the Mark&CORS Lists situated on the right-hand side of the map. Moreover, these icons are employed in the Marks and Sessions table below the map, demonstrating which user marks and CORSs have been grouped into sessions according to the Session Definition metrics established in the Project Preferences.
Note that a user mark may meet the Data & Solution Quality Thresholds immediately based on the particular OPUS solution included in the project. A mark that initially did not meet the thresholds may eventually meet them based on subsequent session or network processing. Similarly, a CORS may not meet the project preferences but still be included and used in the project.
After the processing of a session or the completion of a network adjustment,, the baselines defined in the processing will be displayed as solid color lines on the map.
7.1.7. MARK and CORS Lists
To the right of the map are lists of user marks and included CORSs, as shown in Fig. 7.41.
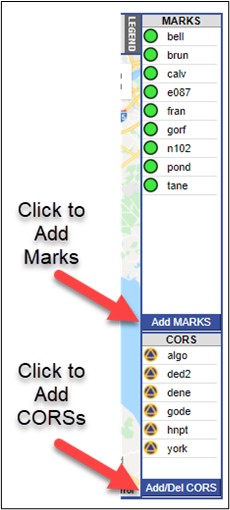
Fig. 7.41 Add Marks and Add/Delete CORS buttons on the Manger’s Page
Like the map icons, holding the cursor over a user marks ID in the list will cause the icon to brighten, and clicking (typical left mouse button) a mark ID in the list causes that user mark’s information bubble to appear on the map identifying its location.
Below the user marks list to the right of the map is the Add MARKS button. This button acts as a link to redirect the user to the OPUS Upload web page where more GNSS observations on user marks may be added. An example of the redirect message is shown in Fig. 7.42.
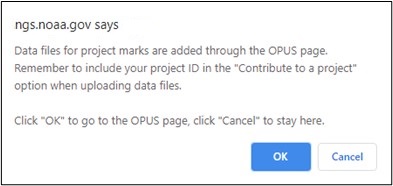
Fig. 7.42 Reminder pop-up window for uploading observation files to the project through the OPUS upload page
Tip
Using the “Add/Del CORS” feature while on the Manager’s Page assures that the CORSs selected will be used in every session
Below the CORS list, at the bottom right of the map, is the button. Clicking this button opens a new pop-up window, shown in Fig. 7.43, with controls to add additional CORS to all sessions in the project.
The map appearing in the Add/Del CORS window is similar to the map on the Managers Page. You may zoom in and out and drag the map to other areas. Notice the icons are color coded to reflect how long they have existed as a CORS. As you zoom in to the map, notice that the sites that have been operational for shorter periods of time begin to appear. In stable areas of the country, the longer a CORS has been in operation, the better estimate of its velocity, and the greater the expectation that the CORS data will overlap with your project. Guidelines for selecting CORSs are presented in Section 8.
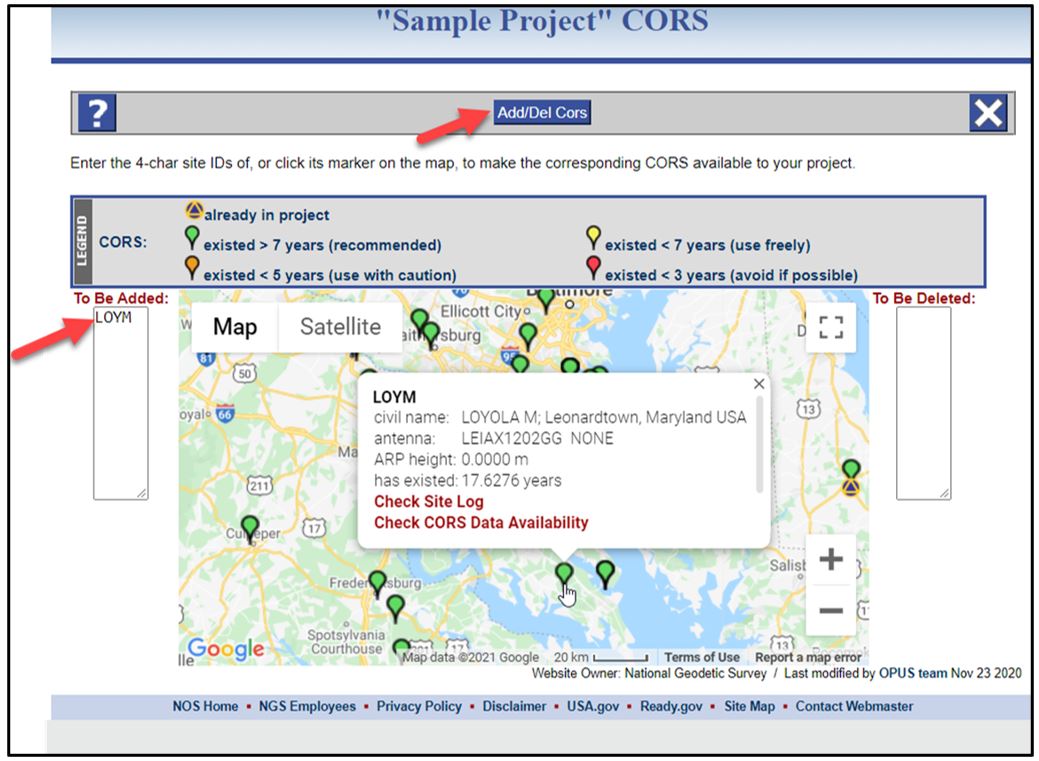
Fig. 7.43 The Add/Del CORS management pop-up window
Move the cursor over the CORS icon to see the CORS ID. Clicking on the icon gives you the option (within the information bubble) to check the CORS site log as well as the data availability. You can also add that particular station to a list on the left side of the window. When you have completed adding CORS to that list, click the Add/Del Cors button at the top of the web page to populate the project with those additional stations.
Caution
If you add CORSs after a given session has been processed (see “Session Processing,” Section 7.2, below), you will have to re-process that session again.
7.1.8. Email the OPUS Projects Team
At the bottom of each web page, an email link to the OPUS Projects Team, highlighted in Fig. 7.44, always appears providing a convenient method to ask questions or make comments. The project manager may receive more than one reply from NGS staff depending on the subject of the email.
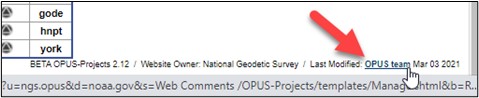
Fig. 7.44 Submitting Comments to & Asking Questions of the OPUS team