7.3. Mark Pages
Descriptions, photographs, occupation information (i.e. metadata) and processing results for individual user marks appear on dedicated web pages for those marks.
A project manager can navigate to these mark pages using the links provided in the Sessions & Solutions table; others can navigate to these pages using the links in the Solution Quality Indicators table or the Data Availability table (see Fig. 7.51). These tables always appear directly under the map on their respective web pages. In all cases, the mark IDs that serve as row labels in these tables are links to the corresponding user mark web page. Project members can also navigate to individual user mark web pages using the mark ID in the pop-up bubbles that appear when a mark icon on a map is clicked.

Fig. 7.51 Accessing a mark page from the Manager’s Page
The Mark Page, as shown in Fig. 7.52, has several sections and controls specific to each section. Furthermore, additional controls appear (or are enabled) if a marks web page is accessed by the project manager.

Fig. 7.52 Example mark page
Caution
If submitting your project to NGS for publication, make sure the Mark Occupation Table is complete and the designation agrees with the description file designation.
7.3.1. Map of the User Mark Area
The map in the Mark Page is similar to the maps seen in the other OP web pages. The default zoom level of the map is very limited to the area near the mark. Zooming out a few levels will show the mark in the context of its surroundings. A slight difference is that the legend allows the user to toggle among the different mark pages, as shown in Fig. 7.53. It also allows different elements (and spatial scales) to be viewed (see Fig. 7.54), including just the mark itself (” This Mark “), all user marks (” All Marks “), or all marks including the selected CORSs (” Marks&CORS “).

Fig. 7.53 Mark page toggling from the map
Toggle among the different user mark web pages.
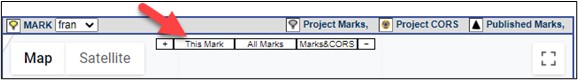
Fig. 7.54 Mark page zoom controls
Select desired auto-zoom level or manually zoom in or out.
Four types of marks may appear on the map:
 Indicates the location of the mark.
 Indicates the locations of other marks in this project. (Initially, the map shows only a small area so other marks in the project may not appear until the map is shifted or “zoomed out.” )
 Identifies CORS used in the project.
 Identifies nearby marks for which NSRS information exists in the NGS database, though not necessarily part of the project, but are shown because they help form the reference frame like the CORS.
 A user mark which has a PID in the NGS database.
Clicking on one of these mark icons reveals a pop-up window displaying the marks datasheet. Recall that a PID can be associated with a user mark when its data files were uploaded, when its description file is loaded, or by using the controls on the project’s mark web page.
7.3.2. Standard Datasheet Pop-up Window
Clicking on the icon for a mark with a triangle on the map opens the marks datasheet in a separate window, an example is shown in Fig. 7.55.
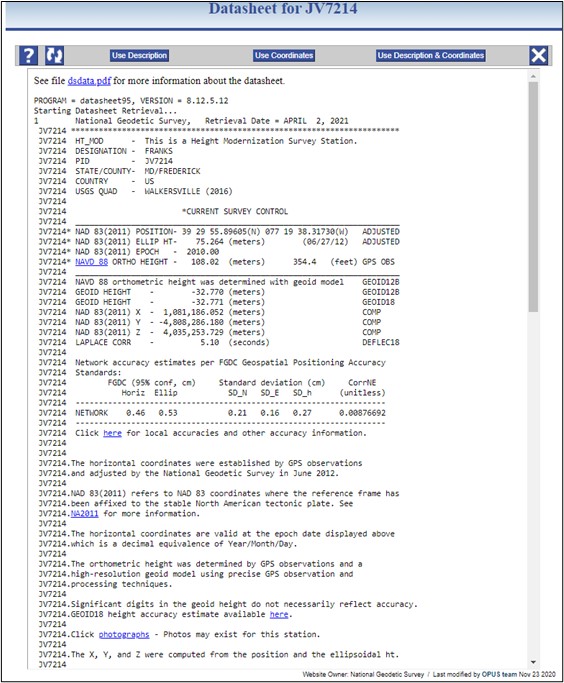
Fig. 7.55 Datasheet Retrieval by way of a user mark with a PID in the NG database
The banner for this window provides the mark’s Permanent Identifier or PID in the title (JV7214 in the title “Datasheet for JV7214” in the example above). Typical pop-up window controls are located just below the banner: ‘Help’ and ‘Refresh’ buttons on the left; a ‘Close’ button on the right. Below the controls, the datasheet is given.
Use Description applies information from the datasheet to the description elements for this user mark. In other words, the published description can be applied to this mark, but it will not supplant/replace information previously entered at upload or by the project manager.
Use Coordinates allows the user to change the a priori coordinates for this user mark with the record mark’s (published) datasheet coordinates. For more information on a priori coordinates see the Glossary.
Caution
If a user uploads a published mark’s description file, which would include the official coordinates for the mark as published on the NGS datasheet, the a priori coordinates would also change to the published coordinates.
Danger
Changing the a priori coordinates for a project mark invalidates all existing project processing for that mark. For this reason, it is recommended to “use coordinates” or upload description files prior to any session processing and network adjustments.
Use Description & Coordinates is a simple convenience activating both of the other controls simultaneously.
7.3.3. Controls
The web page’s controls appear to the left of the map. Standard controls are always available, but additional controls are provided for the project manager (see Section 6.1).
The Help, Back, and Refresh buttons provide the same features as in other pages. The Manager’s Page button returns to the Manager’s Page. The Show File button (shown in Fig. 7.56) operates in the same way as in the Managers Page. It opens a pop-up window for displaying solution reports, an example is shown in Fig. 7.57. As before, the availability of reports depends on the level of processing completed.
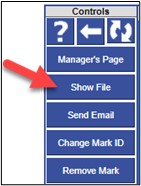
Fig. 7.56 Show File button on the Mark Page Controls bar
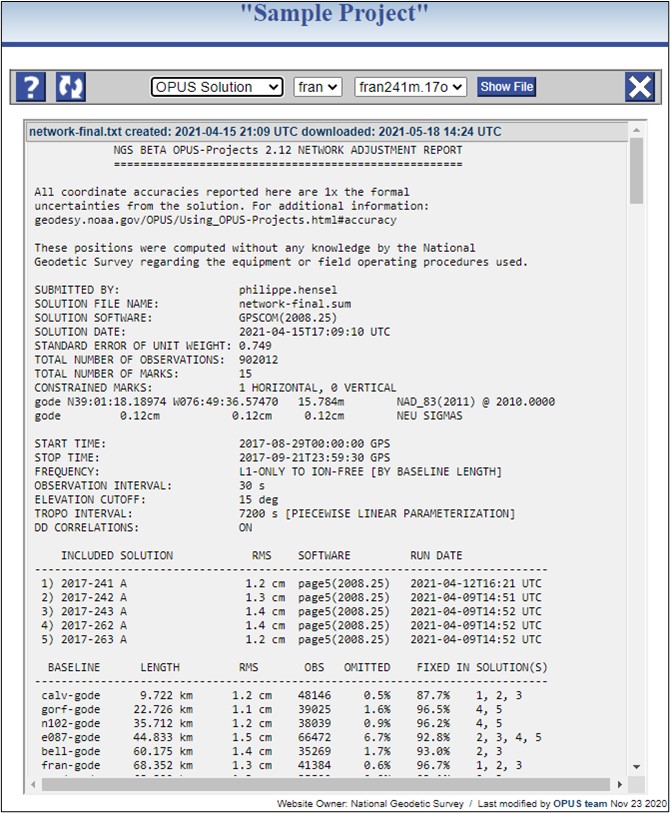
Fig. 7.57 OPUS Solution Report for a user mark
Some browsers offer a print option by right-clicking (right mouse button) anywhere in the report. All browsers should allow the reports text to be copied and pasted into another file using the method typical of the operating system.
7.3.4. Change Mark ID

Fig. 7.58 The Change Mark ID button on the Mark page Controls panel
The Change Mark ID button, as shown in Fig. 7.58, opens a pop-up window (see Fig. 7.59 for an example) with controls to change this mark’s four-character ID. Typical pop-up window controls appear across the top of the window. Below those controls are the rules for a mark ID, then two entry fields: an entry and confirmation field. When the new mark ID field is changed, the confirmation field is enabled (no longer grayed out). To ‘Apply Change and Close,’ the input and confirmation IDs must match.
In the example below, OP did not find a unique mark ID in the first four characters of the corresponding RINEX file (nor did it find another mark already loaded in the project that lies within the mark co-location preference), so it automatically assigned “a001” as the mark ID. The user may want to use the “Change MARK ID” capability to force OP to use the correct mark ID (in this case, “fran”).
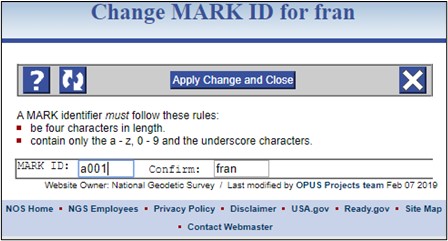
Fig. 7.59 Change Mark ID pop-up window
7.3.5. Remove Mark
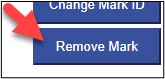
Fig. 7.60 The Remove Mark button on the Mark page Controls bar
The Remove Mark button, as shown in Fig. 7.60, will display a message requesting confirmation before removing the mark, shown in Fig. 7.61. If confirmed, the mark, its data files, all processing solutions and network adjustments that include the mark will be removed from the project and the updated Managers Page will be displayed.
A user may want to remove a mark from a project for a variety of reasons:
A wrong observation file (e.g. from another project) was loaded to the current project by mistake
The wrong mark was observed by the field crew
Only one observation exists for a mark in the project, so there is no redundancy (“no check” solution). If the project is designed to be submitted to NGS, at least two independent observations are required.
Solution thresholds consistently bad for that mark
Caution
Avoid the temptation to remove a mark if its initial OPUS solution does not meet all Data & Solution Quality Thresholds. Reprocessing the data in Session Solutions can sometimes result in meeting the thresholds. Rather than removing a mark, a session can also be reprocessed by excluding the mark (or excluding the particular data file), thereby easily preserving the option of re-including it if needed.

Fig. 7.61 Confirmation pop-up window for removing a mark from the project
7.3.6. Mark Description Summary
This part of the window displays descriptive information associated with the mark, see Fig. 7.62.
This information can be added or changed by the user, unless a description file has been loaded into the project (in which case these fields cannot be modified). It can also be updated with descriptive information from NGS datasheets if the mark has a PID, and the user selected to “Use Description” from the datasheet pop-up window (see Section 7.3.2, above). However, any descriptive information previously entered by the user will not be overwritten. Note that if a field is editable, any entry by the user replaces whatever OP had there before. The hierarchy used by OP is as follows: Description File>User Input>Datasheets>Descriptive info added after data upload>Nothing (Blank).

Fig. 7.62 Mark Description Summary
The list of identifying descriptors on the left column of the table refer to specific data fields within a description file (Appendix A). They are briefly explained below:
PID: Permanent Identifier assigned when new project marks are observed and their data submitted to NGS.
stamping: Typically this is the name assigned to the mark that the original mark-setter struck into the disk (brass or aluminum cap) when the mark was set and/or reset.
designation: The name assigned to the mark, unique for the area and usually descriptive of the mark stamping or location.
type: A physical description of the type of survey monument (e.g. a disk).
setting: The structure to which a mark is affixed. There is a specific setting optional field to add comments about the setting.
description: (for new project marks) A written statement giving distances and directions (swing ties) to local features (posts, trees, building corners, street centerlines, etc.) along with any other salient features (recommended approach, hazards, etc.). This will help future surveyors recover and assess the suitability of the mark for use in their project. The description may be updated.
stability: An estimate of the long-term stability of the mark.
magnetic: This field specifies any magnetic material in or alongside the setting to aid in mark recovery.
application: This is used to identify marks for specific special applications (e.g. tidal bench marks).
condition: A basic estimate of the mark’s condition.
7.3.7. Upload a Photo
On the top right of the MARK [four-character ID] Description Summary section, clicking on the Upload a Photo button opens a “Manage Photos for MARK [four-character ID]” window, as shown in Fig. 7.63 and Fig. 7.64.

Fig. 7.63 Upload A Photo button within the mark description summary

Fig. 7.64 Upload photos pop-up window
The window in Fig. 7.64 allows the user to upload one each of three different photos for each user passive mark: the closeup photo of the mark itself; an eye-level view of the mark in its setting; and a horizon view showing where the mark is located with respect to surrounding points of reference (see Section 5.3 and Fig. 5.3 for additional information). If you are the owner or manager of a Non-NCN CORS station and can safely provide photos for your station (see Section 5.3 and Fig. 5.4 for additional information), then the window in Fig. 7.64 can also be used to upload: a close-up of the antenna serial number, a close-up of the receiver serial number, and a horizon photo of the station. Photos should adhere to the NGS Photo Submission Guidelines. There is no bulk-upload method available at this time, so all photos will need to be uploaded individually.
Once loaded, the photos will be displayed in the MARK Description Summary, as shown in Fig. 7.65.

Fig. 7.65 Example showing successfully loaded photos on a mark page
7.3.8. Save Description
The Save Description button, shown in Fig. 7.66, saves any changes made to the mark description summary, but only within OP. Any changes saved here will not affect the uploaded WinDesc description files.

Fig. 7.66 Save Description button within the mark description summary
7.3.9. Mark Occupations
This table, an example is shown in Fig. 7.67, provides critically important information on the GNSS data associated with the mark. This table needs to be reviewed carefully to ensure that the correct data are associated, such as RINEX files, dates and start/stop times for each occupation, antenna type, antenna serial number, and antenna heights (refer to field logs to confirm).
The antenna type, antenna serial number, and antenna height are all editable in the table. To change the observation file associated with the mark (which may change the data span), click on the “Manage Data Files” button (Section 7.3.10, below).
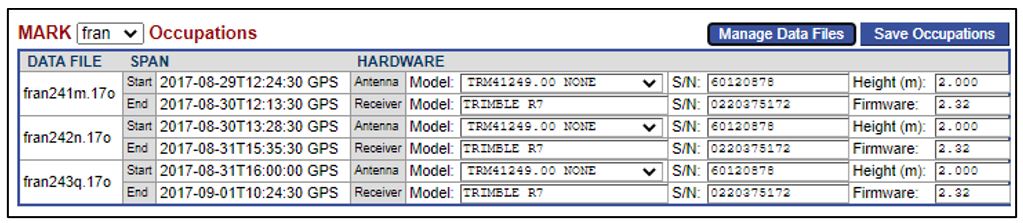
Fig. 7.67 Occupation information on a mark page
7.3.10. Manage Data Files
Clicking on the Manage Data Files button, shown in Fig. 7.68, opens a pop-up window (see Fig. 7.69) where the user can either remove an observation (RINEX file) or associate a given RINEX file with another mark.
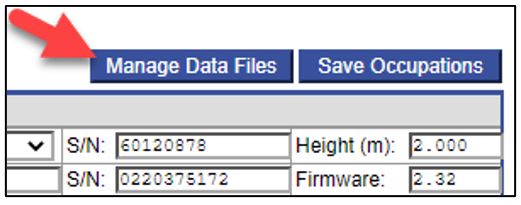
Fig. 7.68 Manage Data Files button on the mark occupations table

Fig. 7.69 Manage a mark’s data file pop-up window
7.3.11. Save Occupations
To save any changes made to the Mark Occupation table, click on the Save Occupations button, as shown in Fig. 7.70.
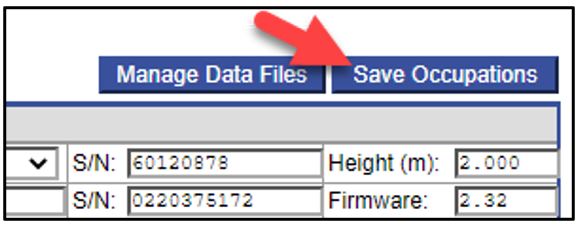
Fig. 7.70 Save Occupations button on the mark occupations table
7.3.12. Manage Coordinates
Clicking on the Manage Coordinates button, shown in Fig. 7.71, opens a pop-up window, an example is shown in Fig. 7.72, where the coordinates, reference frame, and datum associated with the mark are displayed.

Fig. 7.71 Manage Coordinates button on the mark processing results table
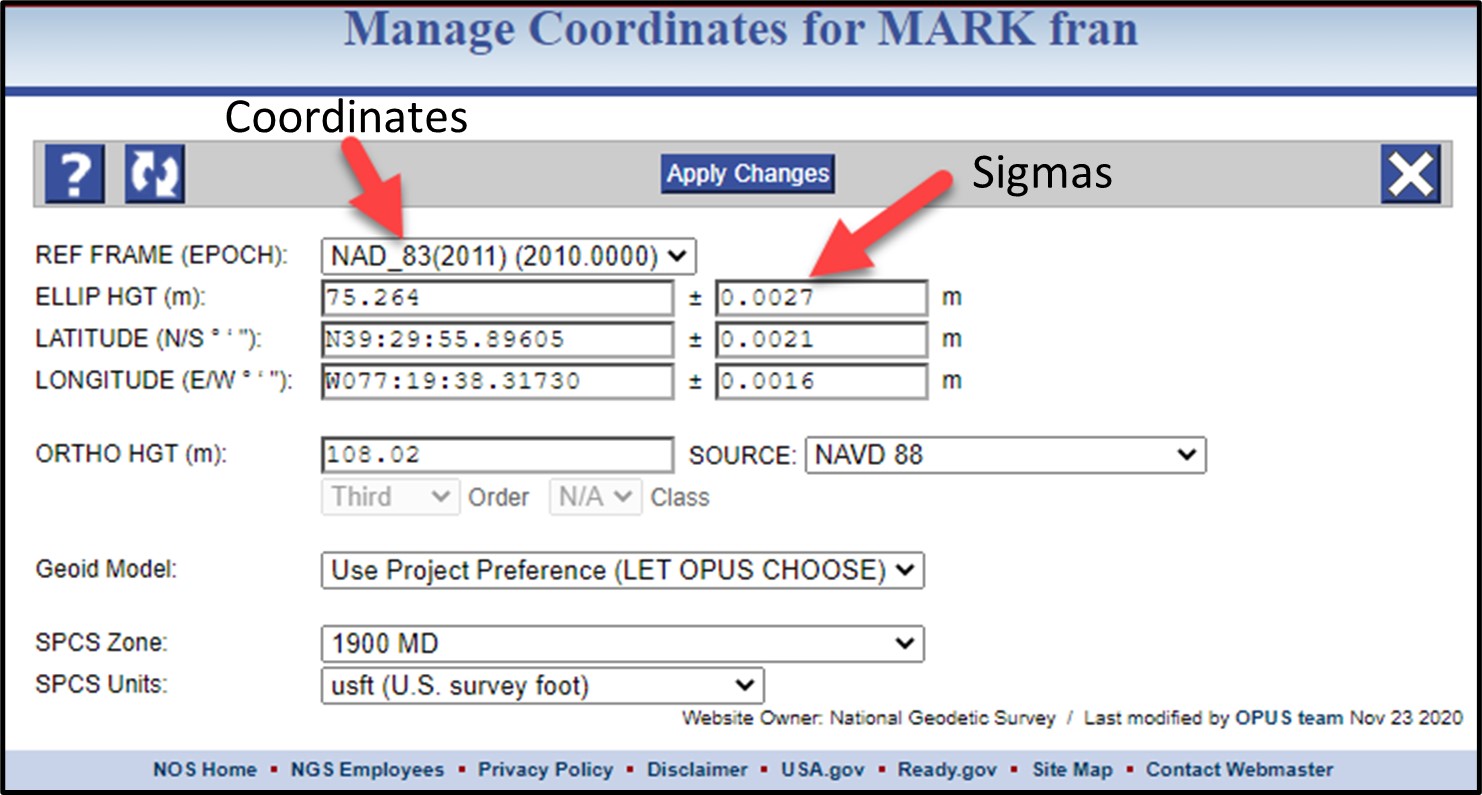
Fig. 7.72 Manage a mark’s coordinate pop-up window showing coordinates, reference frame, and assumed errors (sigmas)
If the mark description has been imported from NGS datasheets (see Section 7.3.2), the coordinates will reflect official published values. Otherwise, the information will come from the first OPUS solution computed for that mark (details in Glossary under “a priori” entry). The data displayed in this window is important as it will be used in subsequent session processing and network adjustments. Not only are the coordinates important, but also the assumed errors (called “sigmas,” to the right of the “±” sign), as well as the reference frames and datums. If any changes are made, make sure to click on the button.
Tip
If the project lies outside the NSRS, the Manage Coordinates window is especially useful to make sure a priori coordinates correspond to their known/published values.
Caution
The Manage Coordinates tool is only available to user marks, not CORSs
7.3.13. Processing Results Plots and Table
The Processing Results scatter plots and the table at the bottom of a Mark webpage provide a summary of all processing results for a mark, as well as visualization of whether these results align with the project preferences. Additionally, OP calculates various confidence levels of the uncertainties and users can view these uncertainty values by choosing an option in the Scale Uncertainties dropdown boxes.
Fig. 7.73 and Fig. 7.74 show an example of these plots and a table of the mark “bcc1”. North/East/Up components on both the table and the Processing Results plots are referenced to a “zero” point coordinates, with OP automatically selecting the “zero” coordinates from the best solutions available in the following order: Network >> Sessions >> OPUS, RTK or other GNSS >> Published solutions.
Users can click on a solution type listed on the Show line located above the plots or table (illustrated by the top red arrow above the Sessions symbol on Fig. 7.73) in order to show or hide a specific group of processing results on the plots and table. Among the four scatter plots, the top-left chart displays the North and East components, while the remaining plots provide information on each of the North, East, and Up components at the observation time. Brief information about a solutions processing result will be displayed when hovering the cursor over a point on any plot. This same information is also shown in the Processing Results table below the plots.

Fig. 7.73 An example of the NEU scatter plots, visualizing the processing results of mark “bcc1”.
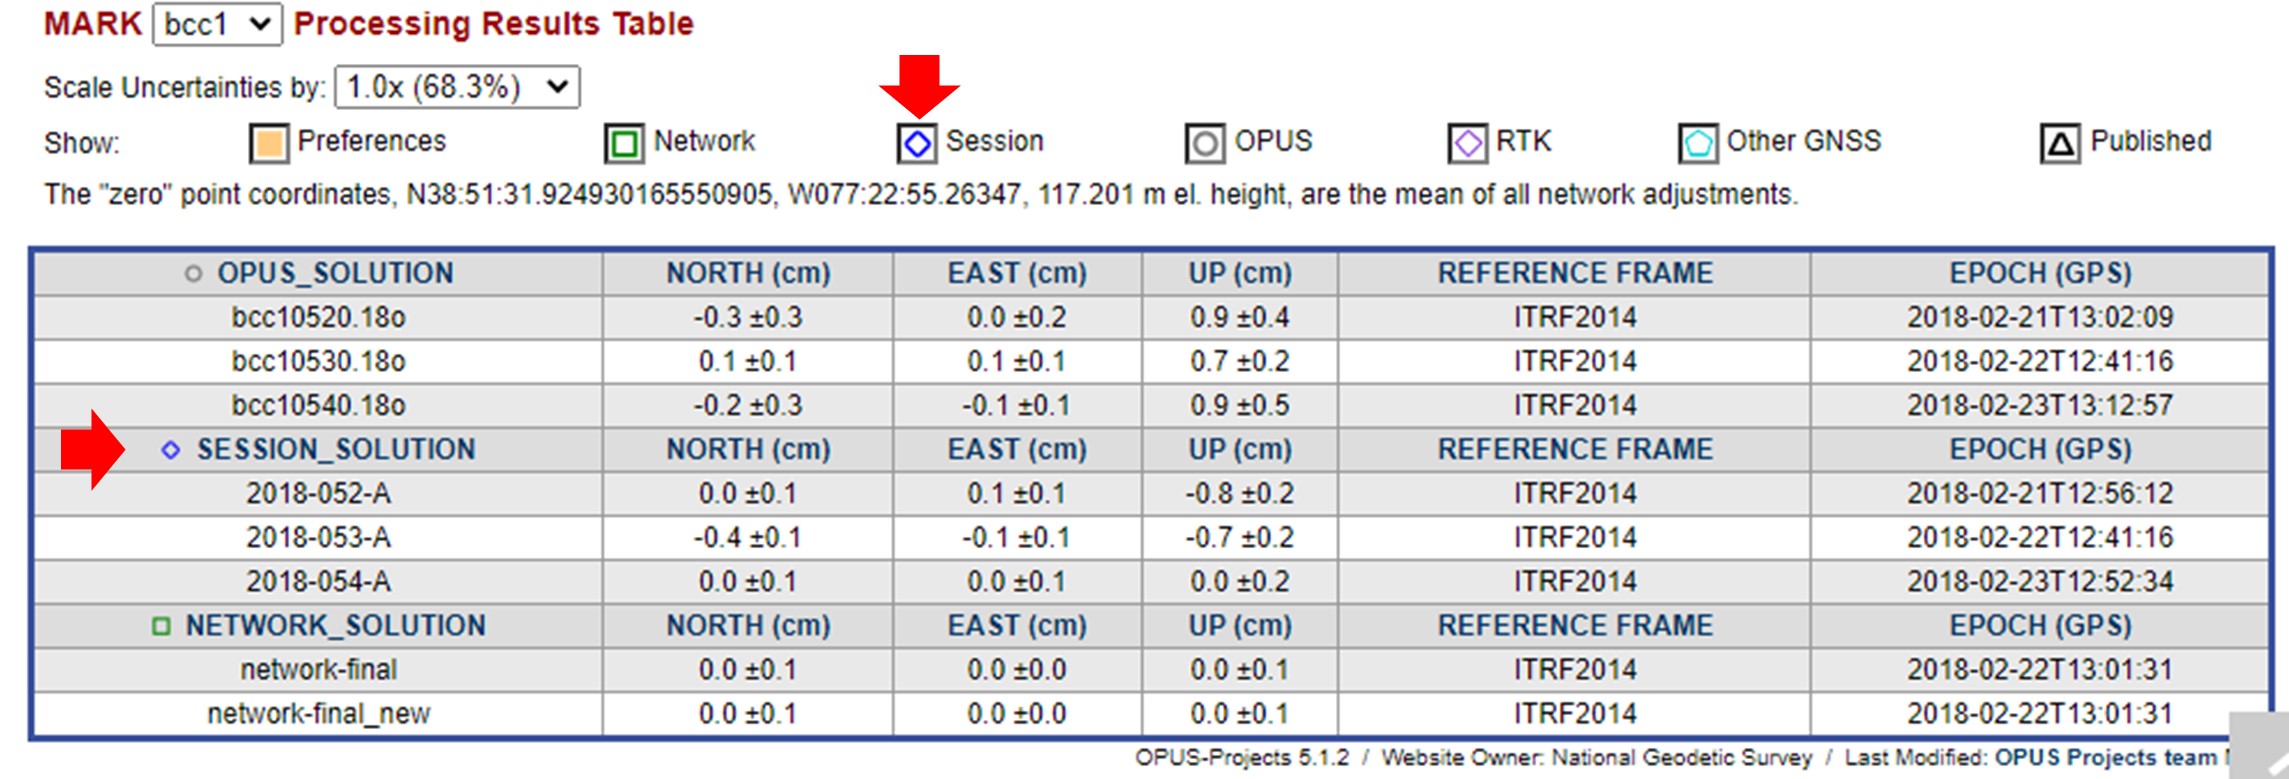
Fig. 7.74 Details about processing results, at 1x uncertainty and referenced to the “zero” point coordinates are listed on the MARK Processing Results Table, as seen here for the mark “bcc1”.