7.4. GNSS Vectors (GVX) Pages
Observations from GNSS Vector Exchange (.GVX) files included in your project can be accessed through various web pages, including the Manager’s Page, Mark Page, GVX File Summary Page, and GVX Baseline Summary Page. OP assigns GVX names based on the uploaded GVX file names, automatically groups repeat vectors as baselines based on marks’ locations given in the GVX files and assigns GVX baselines’ names accordingly. Additionally, users can modify GVX antenna details via the GVX File Summary Page and choose whether to include or exclude a specific GNSS vector or GVX baselines from further GVX baseline processing using the Mark Page, GVX File Summary, or GVX Baseline Summary pages.
7.4.1. Manager’s Page: ALL SESSIONS and ALL GVX VECTORS solutions
Clicking on a mark icon on the map allows viewing of static GNSS and/or GVX observations at that mark. Fig. 7.75 illustrates pop-ups of mark “e087” and “mas2” side by side. The popup for mark “e087” shows all the GVX vectors observed at this mark. There is only a diamond shape next to the mark name, indicating that this mark is a 3D, Upload GVX-only type. The color of each icon in the STATUS column indicates the quality of each GVX vector and whether or not this vector is going to be used in further processing. Green indicates that all GVX observations meet preferences and will be included in further processing. Orange means one or more GNSS vectors do not meet preferences, though still is included in further processing. Dark gray color indicates that the particular GVX vector will not be used (i.e. excluded) in further processing despite its quality, as seen for vector V9 that is provided by the “golden52.gvx” file.
The popup of mark “mas2” displays all static GNSS files uploaded for this mark, as represented by the circle shape near the mark name. Although a diamond shape is listed next to the mark name, indicating that this mark is included in GVX observations, however as no GVX vector is listed in the “mas2” popup, it means that this mark is the initial point of some GNSS vectors, such as a base station in RTK surveys.

Fig. 7.75 Clicking on a mark icon on the map allows viewing of static GNSS and/or GVX observations at that mark. This is a side-by-side pop-up of “e087” - a 3D, Uploaded GVX-only mark, and “mas2” - a 3D, Static processing + GVX mark.
On the Manager’s Page, users can select either “ALL SESSIONS” or “ALL GVX VECTORS” option from the “Results From” dropdown box situated above the map, or the “Occupation From” dropdown boxes beneath the map (as demonstrated in Fig. 7.77 and Fig. 7.78) to visualize all uploaded GVX files on the map and in the summary table.
If the user selects the ALL SESSIONS or ALL GVX VECTORS option, all GVX vectors are visualized on the map as GVX baselines, represented by purple dashed arrows from the initial points to the terminal points. Each baseline comprises repeat GNSS vectors that are automatically grouped by OP, and can be from one or more uploaded GVX files. Clicking anywhere on a baseline on the map provides brief information about the GVX baseline. Fig. 7.76, below illustrates this when clicking on the “e087-mas2” baseline, including all GVX vectors and the GVX file(s) containing these vectors, occupying information including antenna type and height and observation time, and the quality of the GVX vectors. Clicking on the baseline name on this pop-up (the first red arrow) will direct users to its Baseline Summary Page.
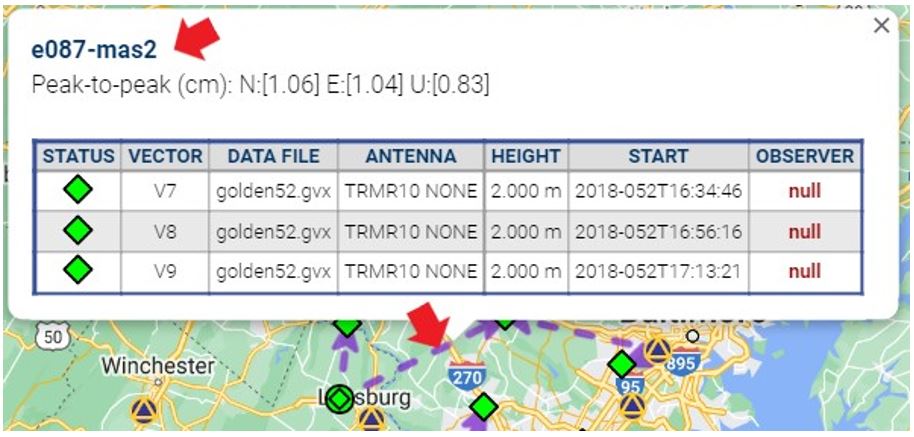
Fig. 7.76 A list of GVX vectors associated with baseline e087-mas2 baseline is shown here when clicking anywhere on the baseline displaying on the map.
Fig. 7.77 shows an example of the Manager’s Page when ALL SESSIONS option is chosen from the “Results From” dropdown. A summary table of static sessions and GVX observation files where these observations occurred, along with the quality of the observations are shown. Clicking on any GVX filename listed in the GVX Files row will direct the user to the GNSS Vector (GVX) Summary Page of the file of interest. In this example, the GVX “golden52.gvx” file contains RTK observations involving these marks: “brun”, “e087”, “fran”, “mas2”, and “paac”. Some of the marks such as “mas2” and “paac” have static GNSS observations at these marks, shown in 2018-052/053/054-A sessions, and appear as 3D Static processing + GVX icons in the table. The mark icon on this table also displays the quality of all GVX vectors observed at this mark and are included for further processing. By clicking on a mark on the table, users can access the chosen mark’s webpage for more details about it. Furthermore, by clicking on a GVX file name, users can go to the GVX File Summary Page to view detailed information about that GVX file (see Section 7.4.3 for more information).

Fig. 7.77 Choosing Occupations From ALL SESSIONS will show uploaded GVX observation files (if available) for involved marks.
Fig. 7.78 below, shows a summary table of all available GVX files and their occupied baselines when choosing the “Occupation” From “ALL GVX VECTORS” options from the dropdowns beneath the map. In this example, all GNSS vectors from “golden52.gvx” file are grouped into 4 GVX baselines: “brun-mas2”, “e087-mas2”, “e087-umbc”, and “fran-paac”, where “brun”, “e087” and “fran” are terminal points, and “mas2”, “umbc” and “paac” are initial points. Clicking on a baseline name, listed in the first and last columns, will open the GVX Baseline Summary Page of the chosen baseline.
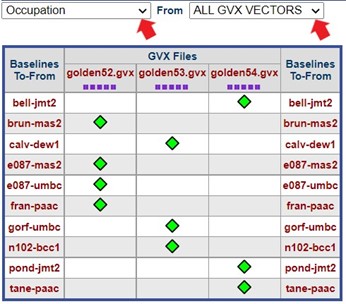
Fig. 7.78 A list of available GNSS Vectors (GVX) files (first row) and their occupied baselines (the first and the last columns) in a sample project are shown when the Occupation From ALL GVX VECTORS option is chosen.
Apart from the GVX baseline summary of all GVX files uploaded in the project, selecting From” ALL GVX VECTORS” option, then the “Statistics” option in the dropdown boxes under the map displays statistics for these GVX baselines, as shown in Fig. 7.79. The statistics include the number of GVX vectors recorded for each baseline, number of GVX vectors used in processing, occupation timespan and epoch, reported PDOP max/min values, and Peak-to-Peak values (P2P) with comparison to the project’s preferences. Cells with orange background, as shown for “fran-paac” baseline’s Up P2P below, indicates that the value does not meet the preference.

Fig. 7.79 Statistics of GVX baselines (the first and the last columns) in a sample project are shown when the Statistics From ALL GVX VECTORS option is chosen. In this example, the baseline “fran-paac” peak-to-peak’s Up component (0.0756m) is greater than the project’s Preferences for Maximum Height Uncertainty (0.060m) and therefore is colored orange for warning.
7.4.2. Mark Page: GVX Occupations and Processing Results
Fig. 7.80 shows an example of a Mark Page where observations at this mark are of the GVX type. Beneath the Mark Description Summary section, information about GNSS vectors going to this mark is provided, including baseline(s), whether or not a vector is included or excluded from further baseline processing as illustrated with red arrows, quality of a vector, GVX observation file, and details of each GNSS vector are displayed. Users can select to include or exclude a specific vector from a baseline (see red arrow 2), include or exclude one or more baselines (see red arrow 1) from further processing. To save any changes made, users must select the Update .GVX button underneath the Mark’s Description Summary section (see red arrow 3).

Fig. 7.80 A Mark Page of a GVX terminal point
Additionally, at the bottom on the Mark Page you can review the scatter plots (see Fig. 7.81) and summary table of all the processing results for the mark (see Fig. 7.82). See Sections 7.3.13 and 11.5.4 for additional information.
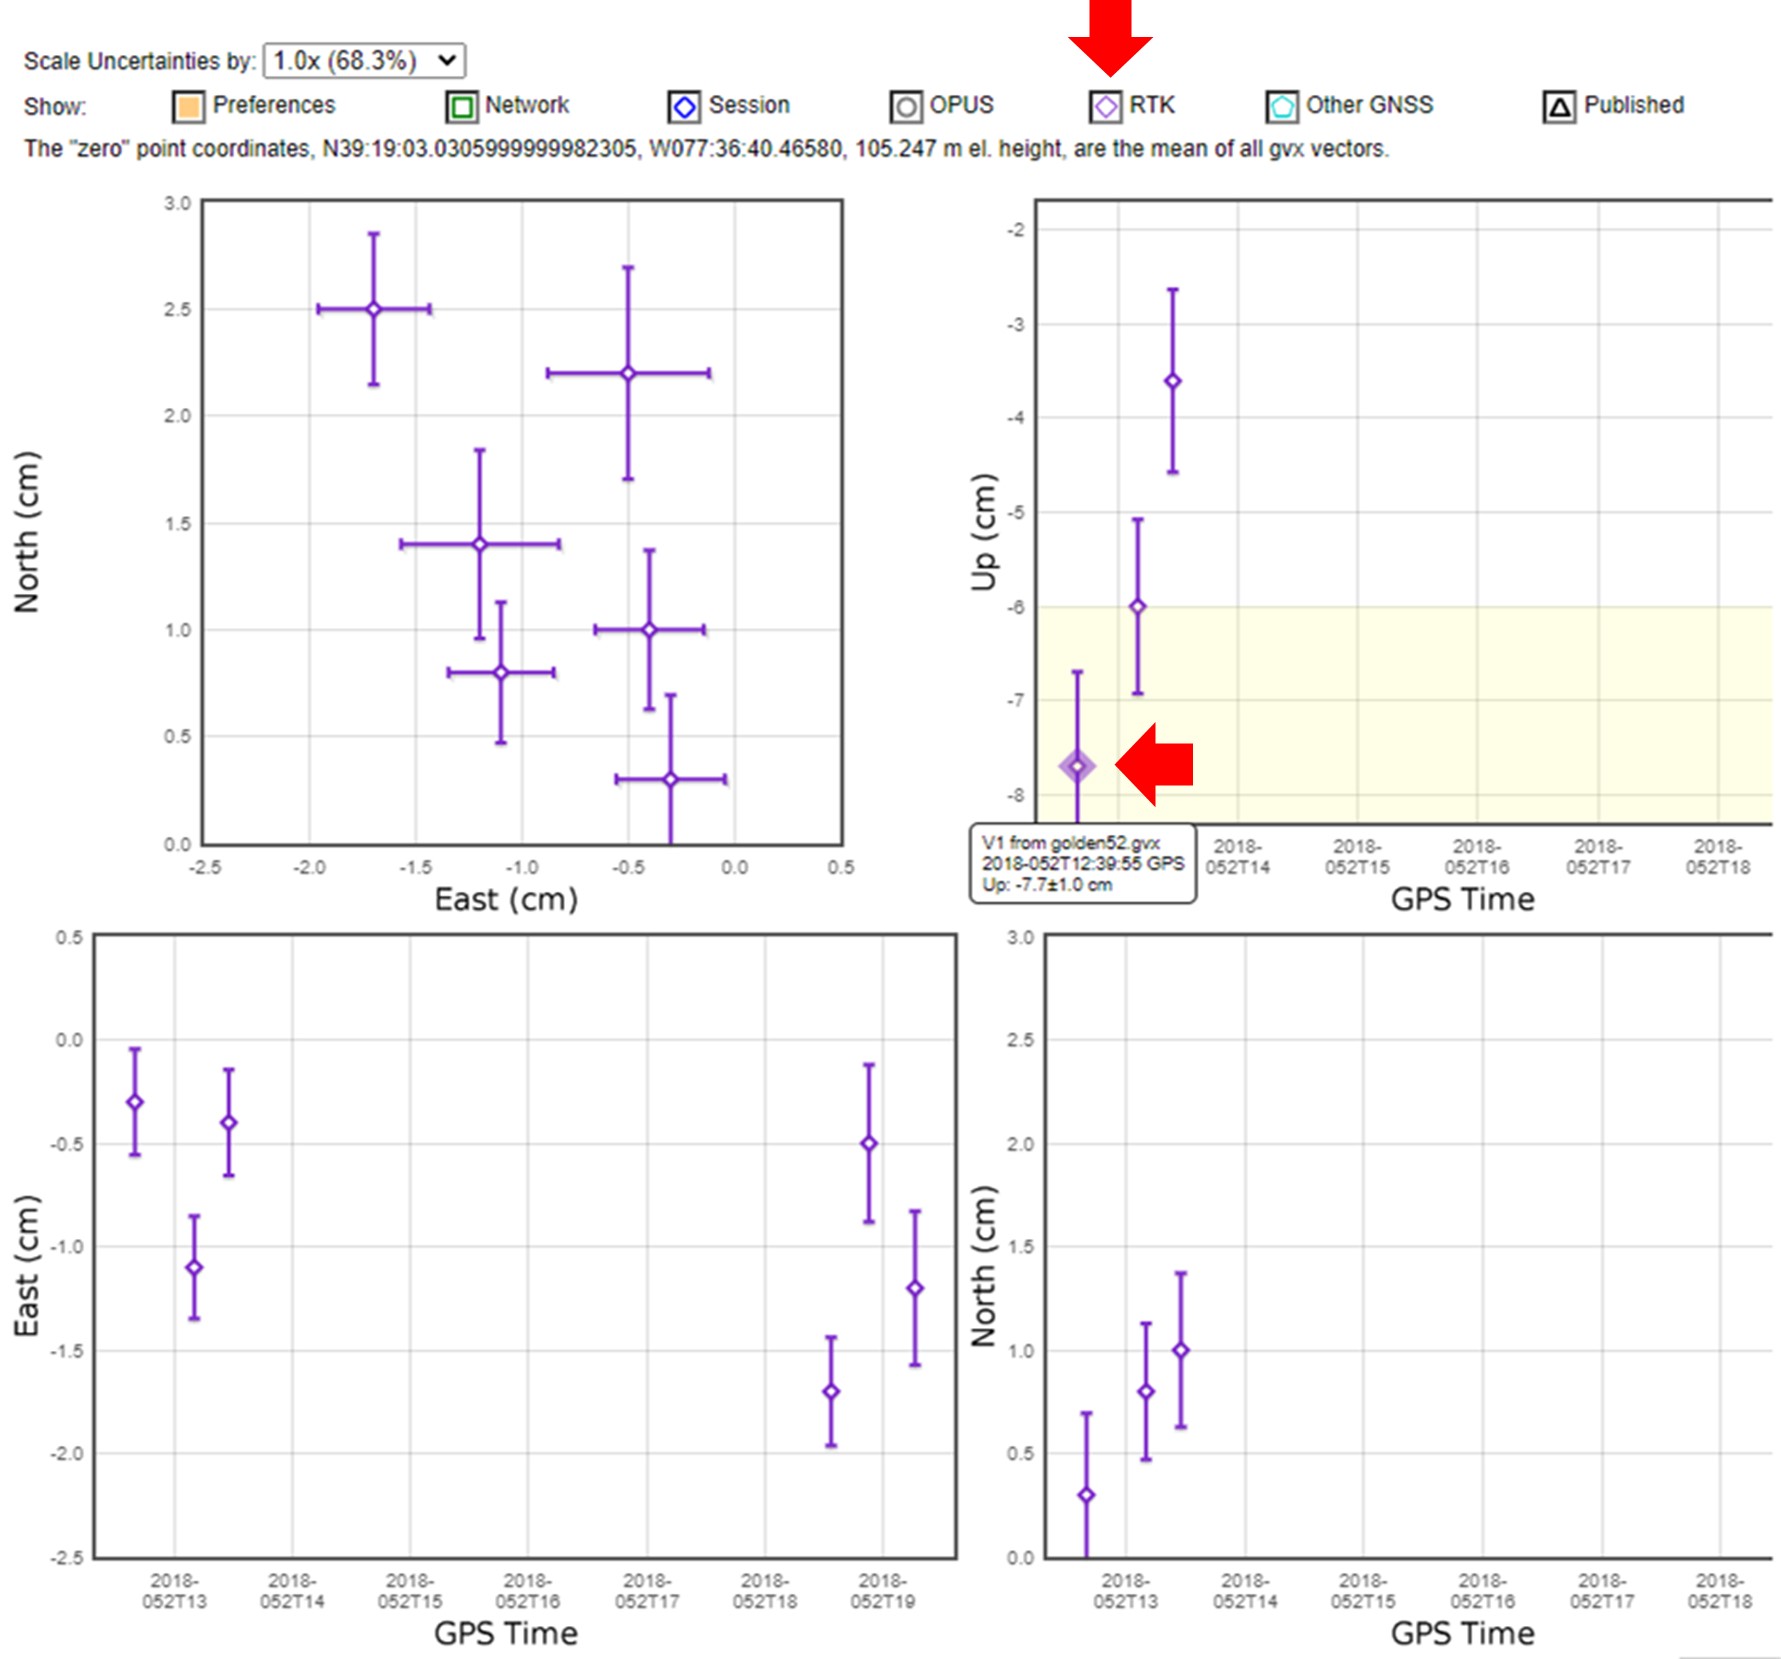
Fig. 7.81 An example of the scatter plots of a GVX mark webpage, showing that the Up component resulting from the GNSS vector V1 doesn’t meet the project’s requirement, as it is located in the yellow region of the chart which corresponds to being outside the Preferences.
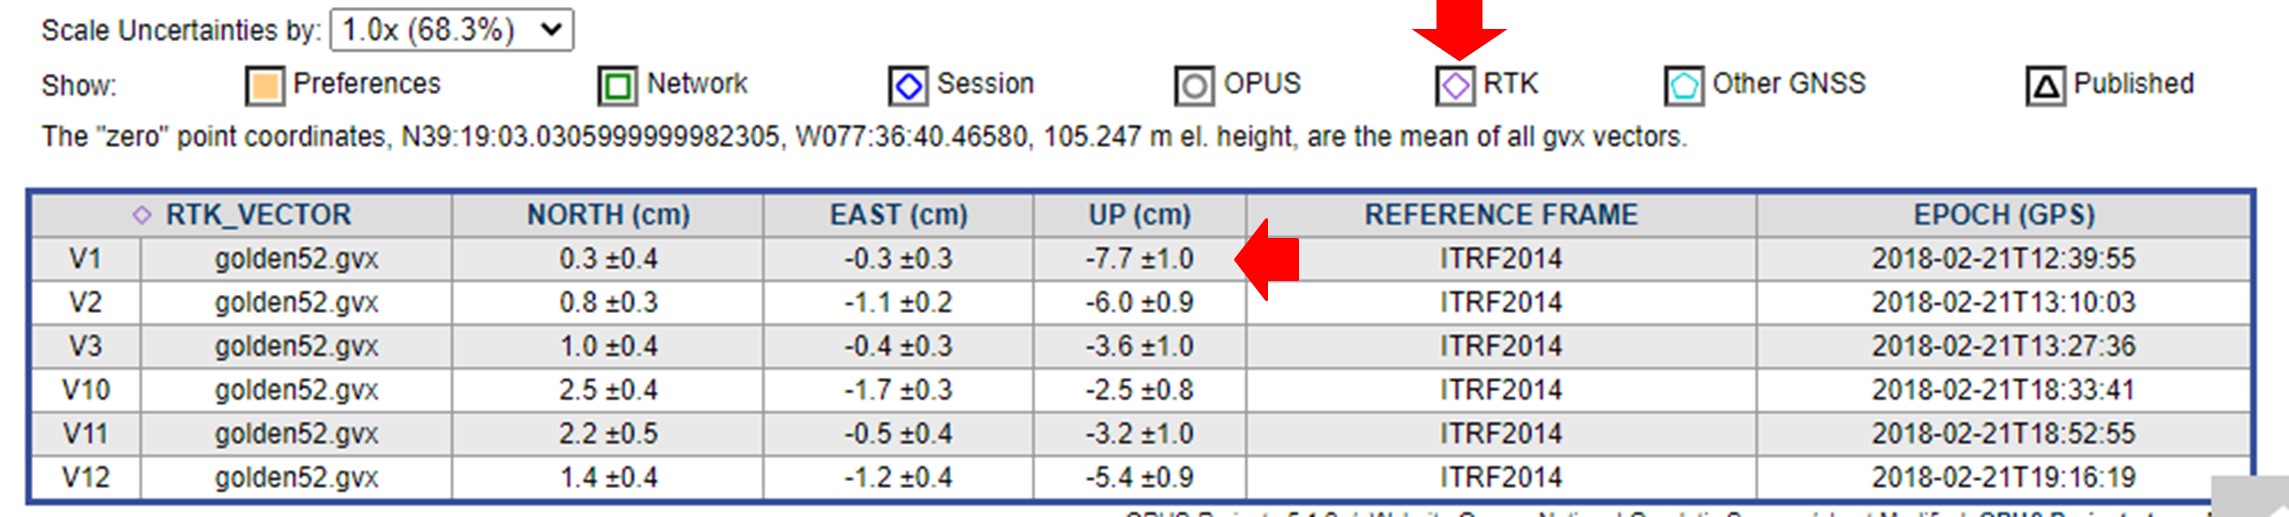
Fig. 7.82 In addition to the above Processing Results plots on a GVX mark webpage, users can see the value of the Up component of this mark resulting from GNSS vector V1.
7.4.3. GVX File Summary Page
The GVX File Summary webpage can be accessed in four ways:
By clicking on any GVX file name listed on the first row of the GVX summary table, resulting from either the Manager’s Occupation From ALL SESSIONS or ALL GVX VECTORS option;
By clicking on a GVX file name listed on a Mark webpage of a GVX mark. An example of such a Mark webpage can be seen in Figure 7-80;
By choosing a GVX file name from one of the GNSS Vector (.GVX) File dropdown boxes on the GVX File Summary webpage, as illustrated in Figure 7-83 below;
By clicking on a GVX file name listed on a GVX Baseline webpage. See section 7.4.4 for further details about the GVX Baseline page.
Fig. 7.83 shows an example of a GVX file Summary Page for the “golden52.gvx” file. This page visualizes the contents of an uploaded GVX file and performs quality assessment of its GVX vectors based on the project’s Preferences. It also groups GVX vectors into baselines and displays these baselines on a map and in a table. Furthermore users can choose to include or exclude one or more baselines or GVX vectors from a baseline, as well as update antenna height of any GVX vector recorded in this GVX file. If desired, users could remove an entire GVX file from the project by clicking on the “Remove GVX” button located on the upper left-hand side of the map.
Detailed information of each GNSS vector is shown in the table below the map, including:
Repeat vectors between the same two marks, organized into “To” - “From” baselines;
Vector ID as stated in the uploaded GVX file or assigned by OP;
GVX vector’s antenna type and height at the terminal point or “To” station. Users can update antenna height of the “To” station of any GVX vector;
PDOP value of each GVX vector;
Observation start and stop times (in GPS time), observation duration and number of epochs used;
Estimated accuracy of a GVX vector from the GVX file, in north, east, and up components;
The total number of satellites used and number of satellites used by GNSS type (C = BeiDou, E = Galileo, G = GPS, J = QZSS, R = GLONASS);
The ephemeris type (satellite orbit information) used;
How the coordinates of a point were derived, such as Keyed-in, Code, Float, Fixed;
Method for how the GNSS vector was derived:: NetworkRTK, Single-baseRTK, or Post-processed;
The name of the baseline processing software for deriving the vector;
The mount point name if the vector was from a real-time network (RTN).
To save any changes made, users are required to click on either of the “Update .GVX” buttons, which are positioned both above and below the summary table. For more information about the GVX format, visit the GVX: GNSS Vector Exchange File Format page.
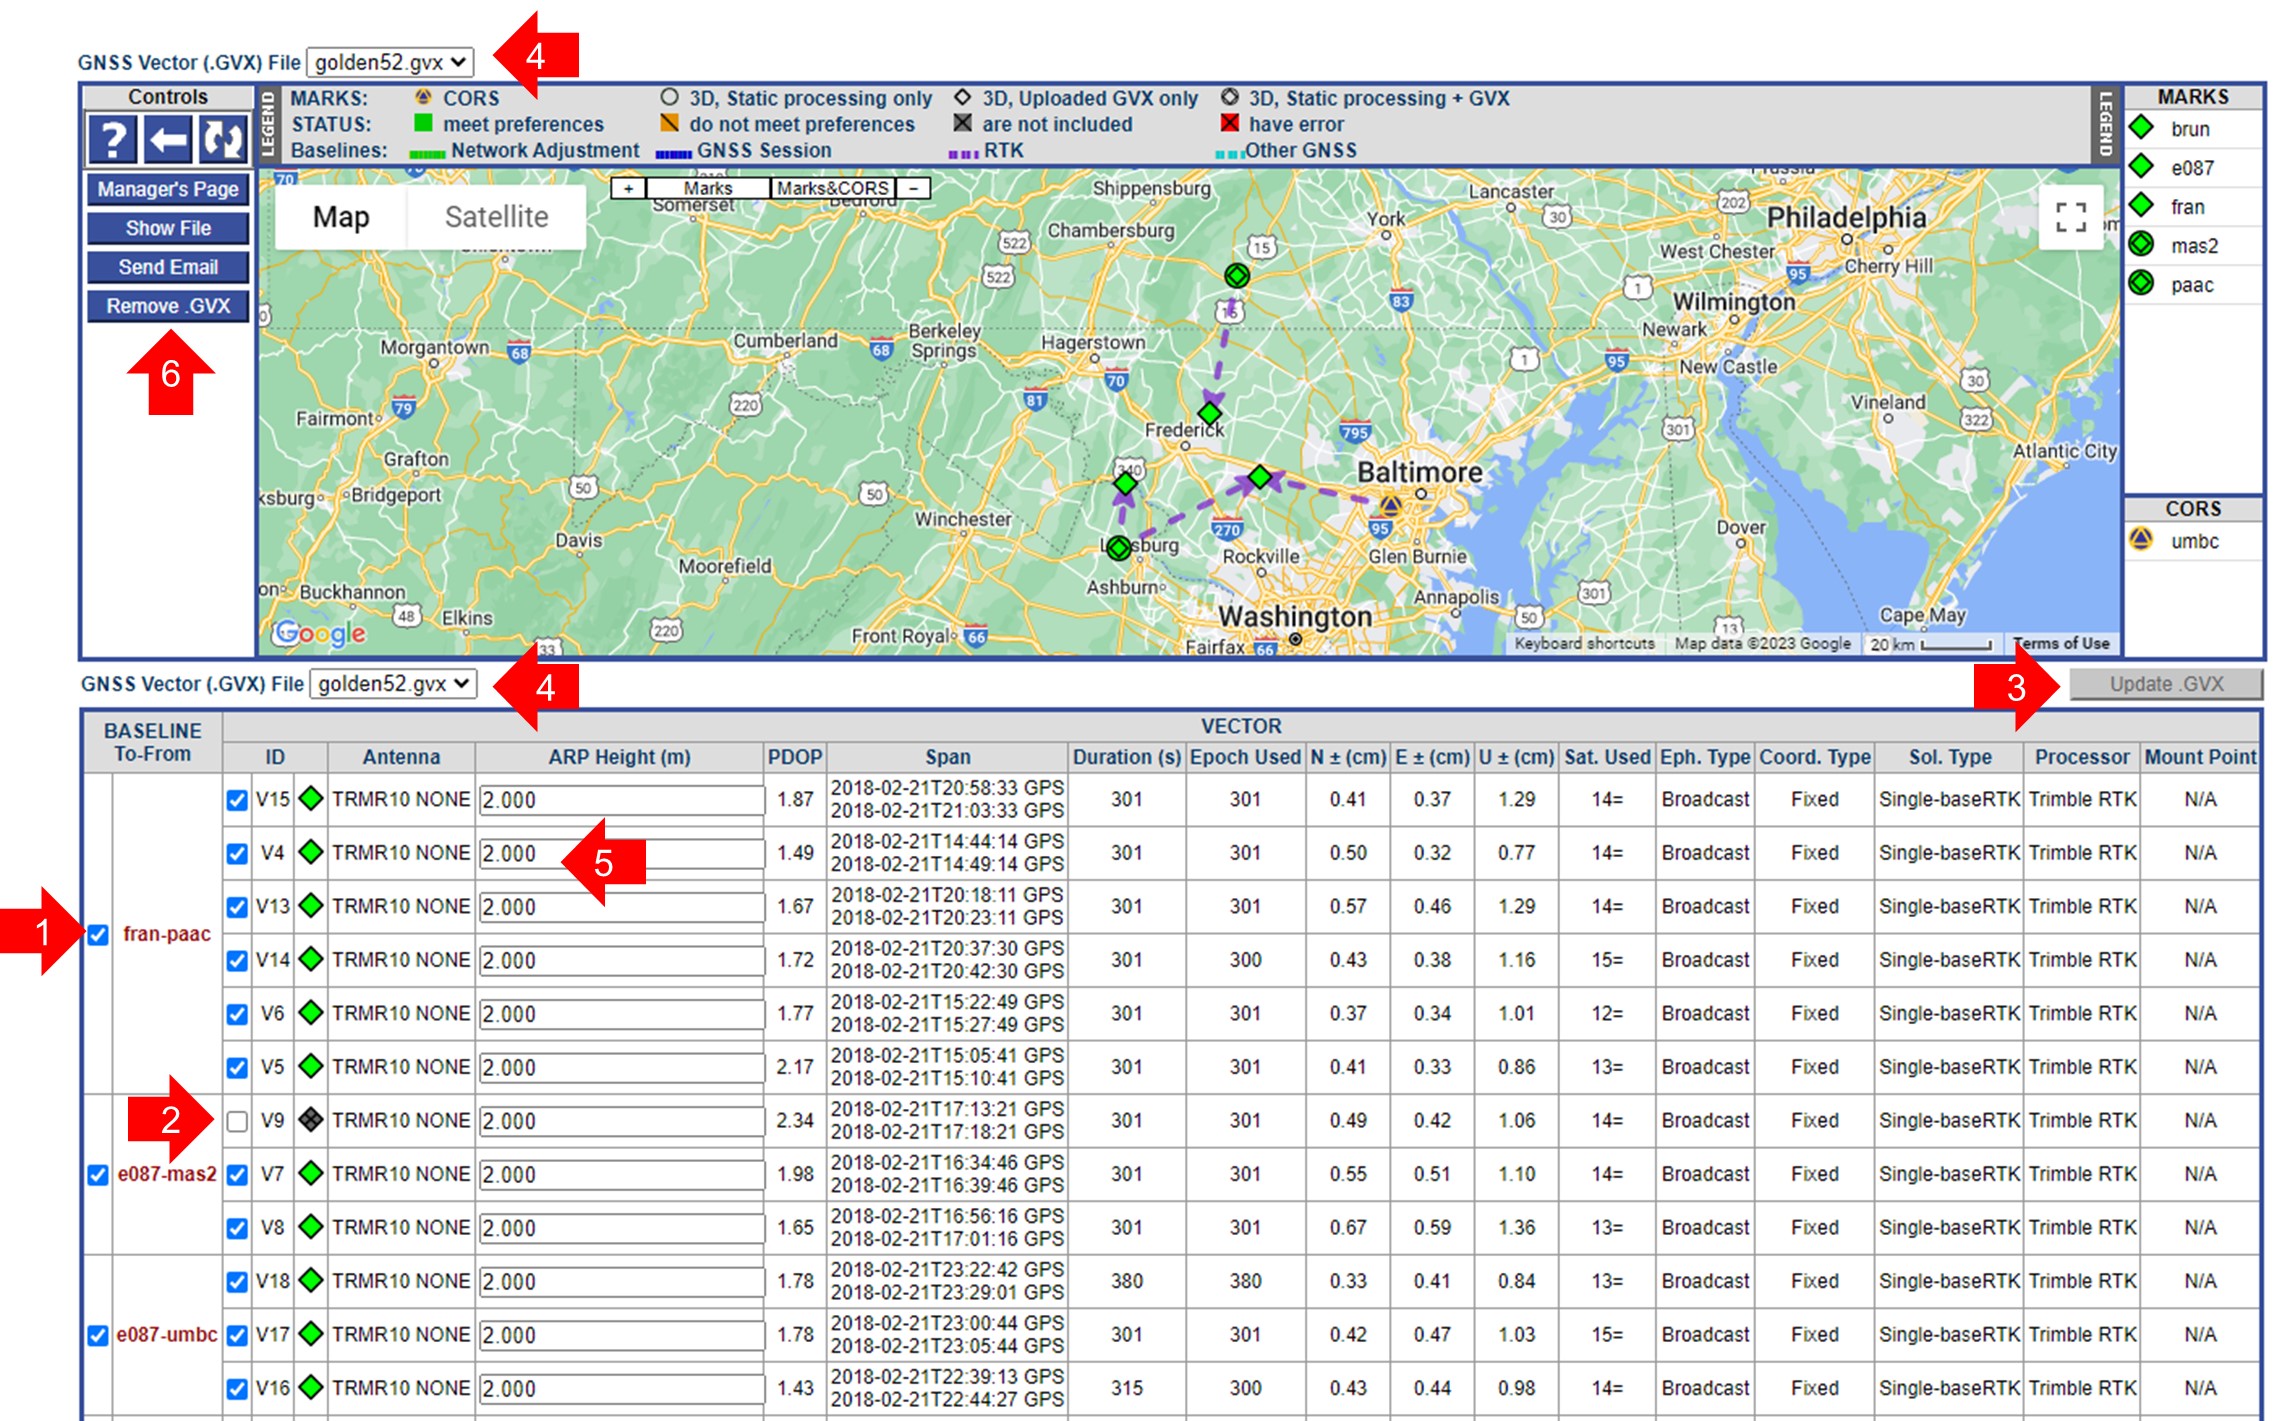
Fig. 7.83 An example showing part of a GVX File Summary Page
7.4.4. GVX Baseline Summary Page
When users upload GVX files to a project, OP automatically groups repeat vectors from the available GVX files as baselines based on the marks’ locations provided in the GVX files. OP also assigns names to the GVX baselines accordingly. Users have several ways to view the content of a specific baseline, including:
By clicking on the baseline name that appears in the popup when the user clicks on any part of the GVX baseline drawn on the map on the Manager’s Page. This feature is available when either the Occupation From All SESSIONS or Occupation/Statistics From All GVX VECTORS option is selected. An example of this feature is shown in Fig. 7.76;
By clicking on a baseline name listed in the “Baselines To-From” columns in the summary table on the Manager’s Page. This table can be accessed by choosing Occupation or Statistics From ALL GVX VECTORS option, as illustrated in Fig. 7.78 and Fig. 7.79;
By clicking on a baseline’s name listed on a Mark Page, as shown in Fig. 7.80;
By clicking on a baseline’s name listed on a GVX File Summary page, either on the map or on the summary table. An example of the GVX File Summary page is shown in Fig. 7.83;
By choosing a baseline from any of the Baseline dropdown boxes listed on the GVX Baseline Summary page.
Fig. 7.84 below, is an example of the GVX Baseline Summary webpage. This page is similar to the GVX File Summary Page, but the data is limited to the selected baseline.
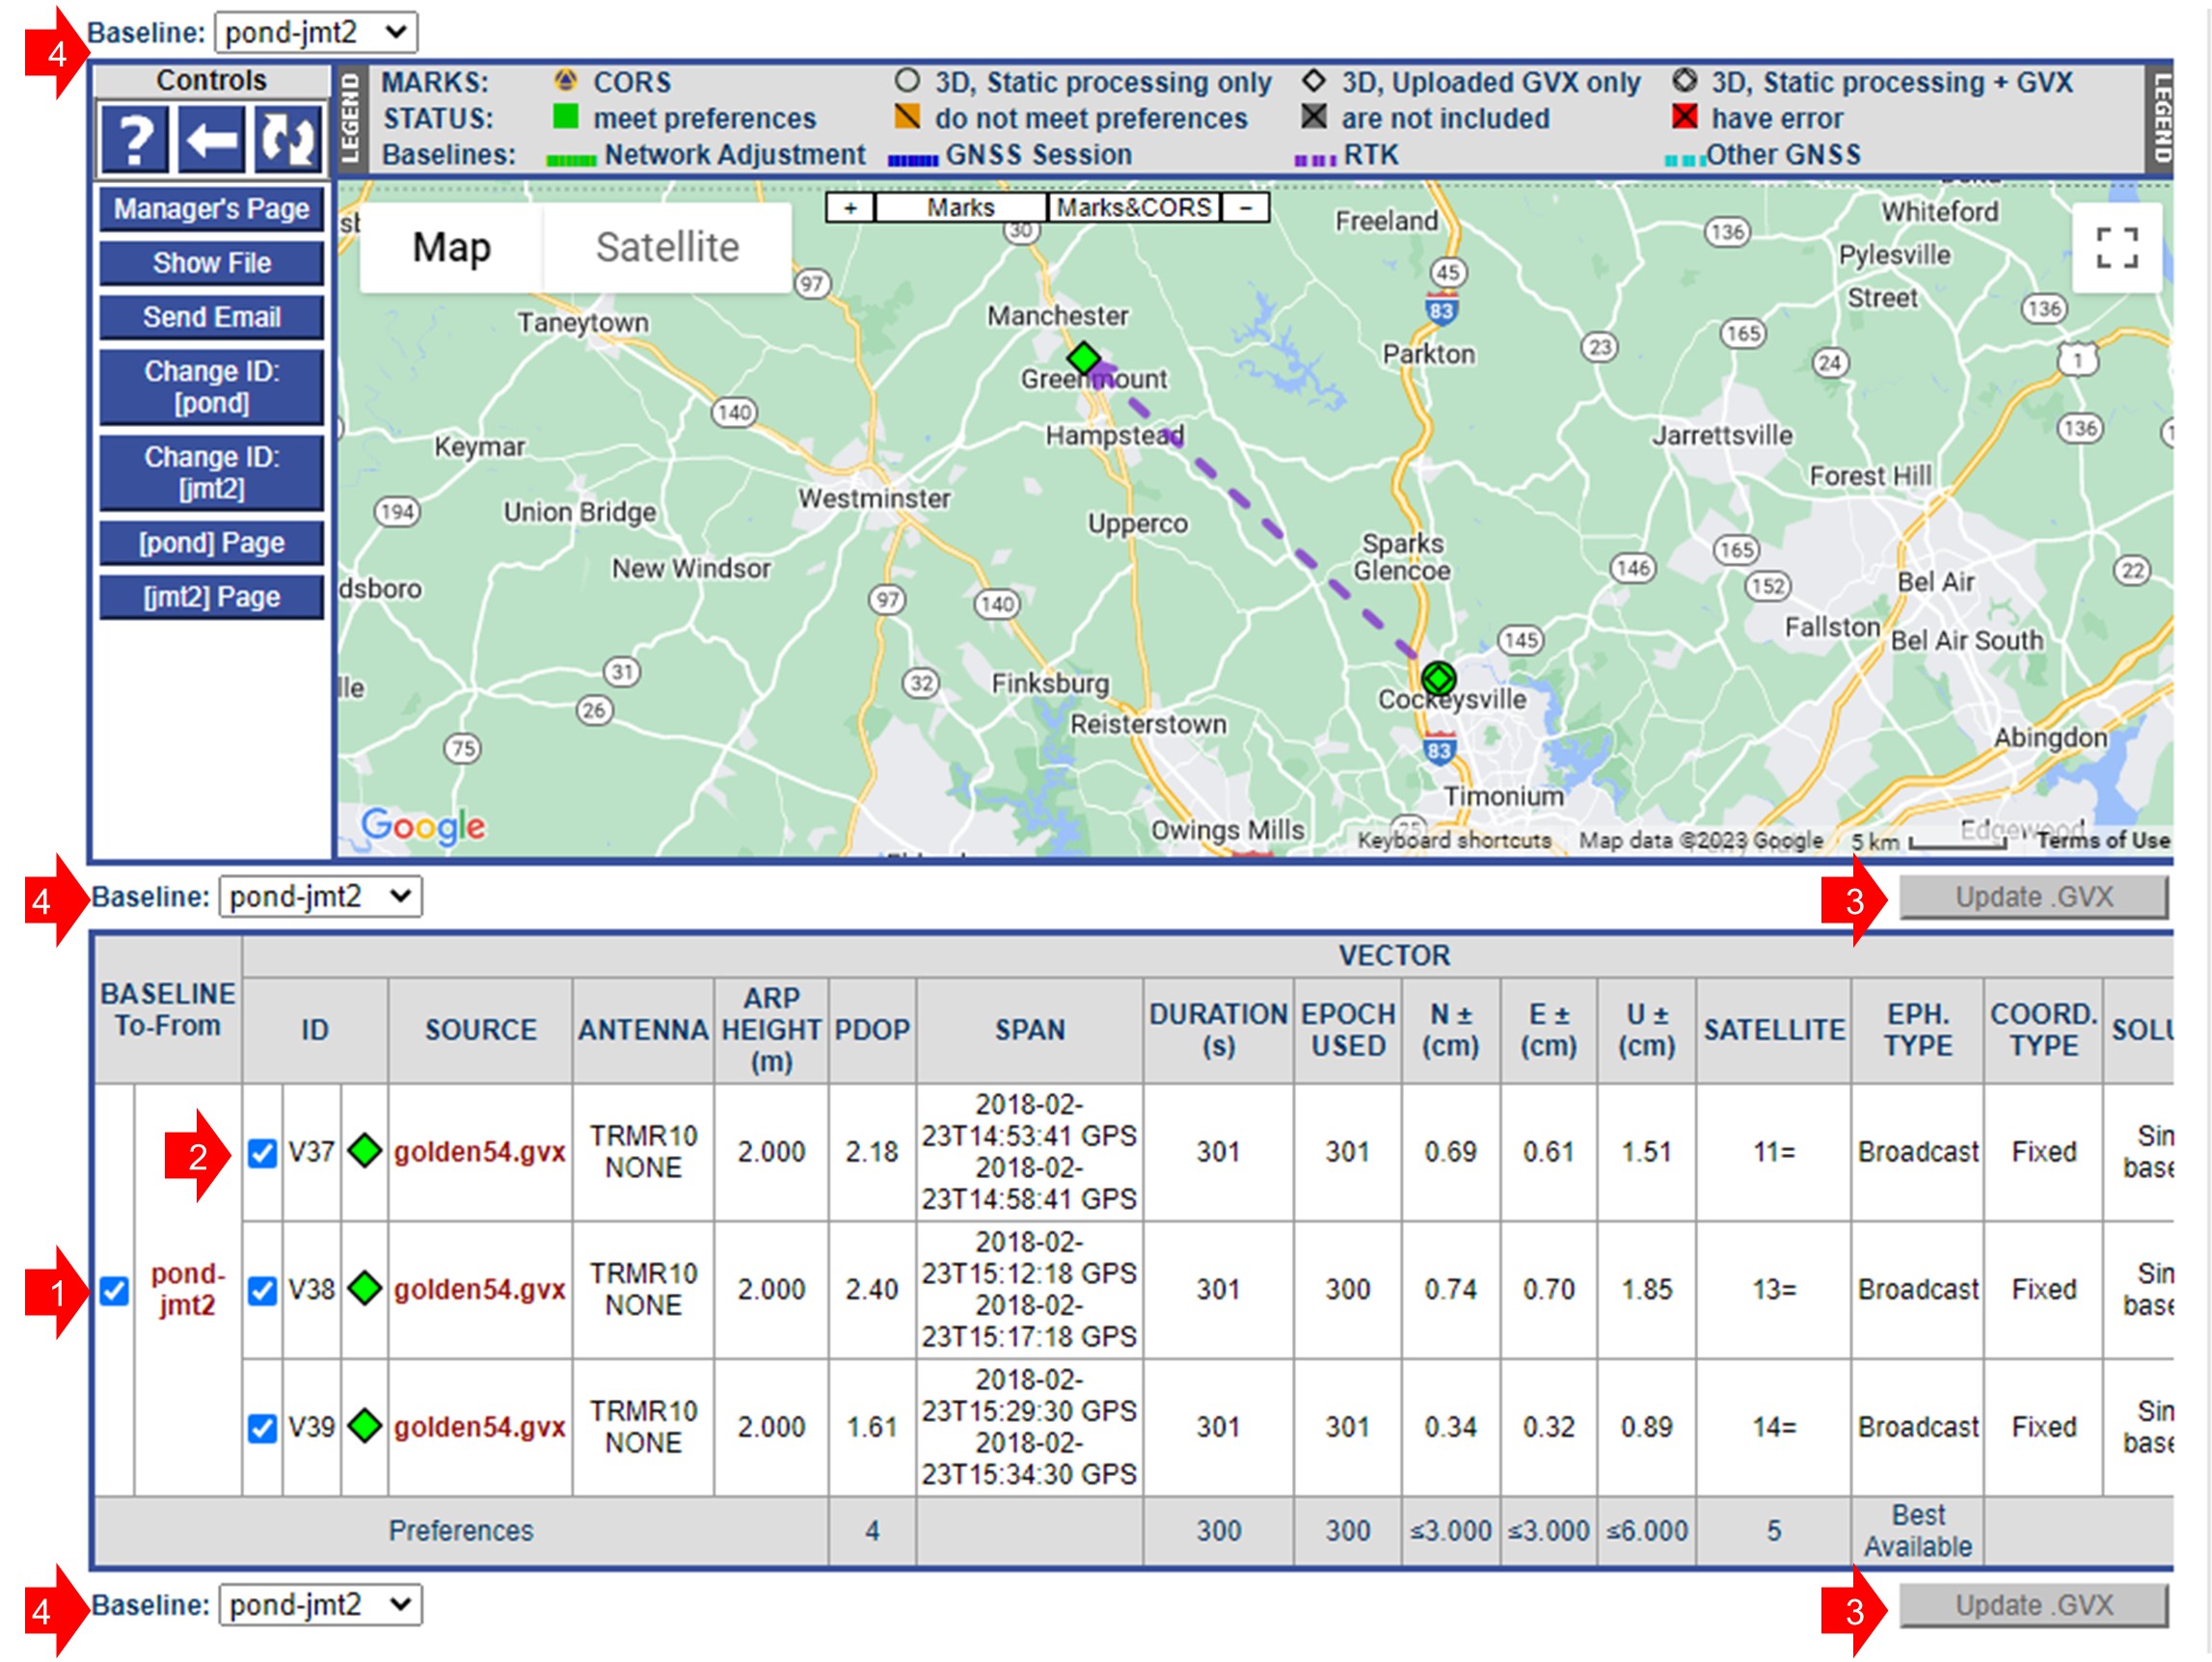
Fig. 7.84 A portion of a GVX Baseline Summary Page
The GVX Baseline Summary Page provides detailed information for the specific baseline in the table below the map, including: 1. The specific baseline name and vector ID; 2. GVX source filename; 3. GVX vector’s antenna type and height; 4. PDOP value of each GVX vector; 5. Observation start and stop times (in GPS time), observation duration and number of epochs used. 6. Estimated accuracy of a GVX vector from the GVX file, in north, east, and up components; 7. The total number of satellites used and number of satellites used by GNSS type (C = BeiDou, E = Galileo, G = GPS, J = QZSS, R = GLONASS); 8. The ephemeris type (satellite orbit information) used; 9. How the coordinates of a point were derived, such as Keyed-in, Code, Float, Fixed; 10. Method for how the GNSS vector was derived: : NetworkRTK, Single-baseRTK, or Post-processed; 11. The name of the baseline processing software for deriving the vector; 12. The mount point name if the vector was from a real-time network (RTN).
In Fig. 7.84, users can also choose to include or exclude the selected baseline from further processing, as illustrated by the red arrow 1, or include or exclude a specific vector, as shown by the red arrow 2. To save any changes made, users must select the “Update .GVX” button, located below the map on the right-hand side of your screen, shown with red arrow 3.
Additionally, the GVX Baseline Summary Page features scatter plots of each vector’s terminal point at the bottom of the page, providing a visual representation of the spread between repeat vectors for the selected baseline, as shown in Fig. 7.85. The plots work in the same manner as the Mark Pages plots, as described in Section 7.3.13 and Section 11.5.4.

Fig. 7.85 An example of the baseline solution plots that aid in visualizing the spread between repeat vectors of the same baseline