7.2. Sessions and Solutions Page
Session processing involves the processing of two or more GNSS data files whose contents were collected with substantial (observation) time overlap to estimate the coordinates of the marks where the data were collected. This is done by selecting one or more marks to act as reference stations. For more explanation of session processing, see Section 11.
The project manager can access a session web page from the project Manager’s Page by clicking on the Session ID displayed in the Marks and Sessions table (see Section 7.1.5, above). Other project members can access the session pages by entering the Project ID and Session Keyword as well as their email address in the OP gateway page, as shown in Fig. 7.45.
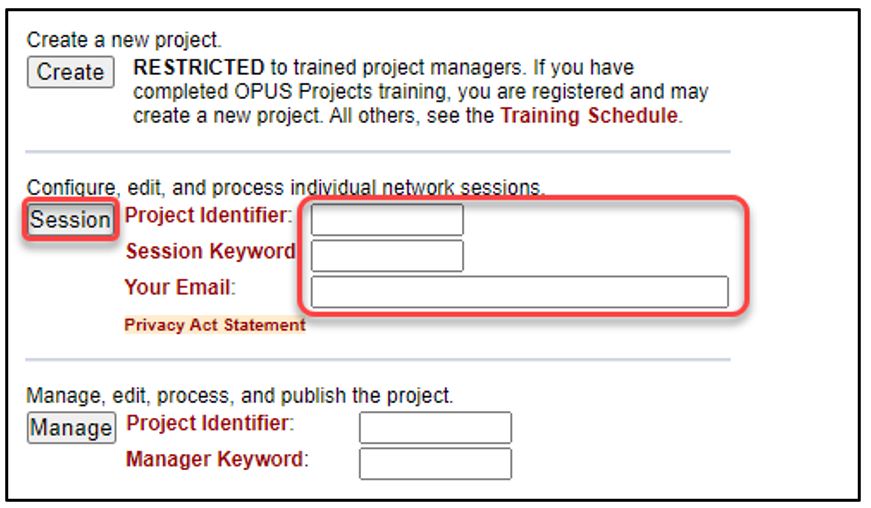
Fig. 7.45 Restricted access to session processing
The Session Page, shown in Fig. 7.46, looks very similar to the Manager’s Page, except that there is less functionality in the controls on the left panel and the table on the lower left. The Map features remain essentially the same as in the Managers Page.
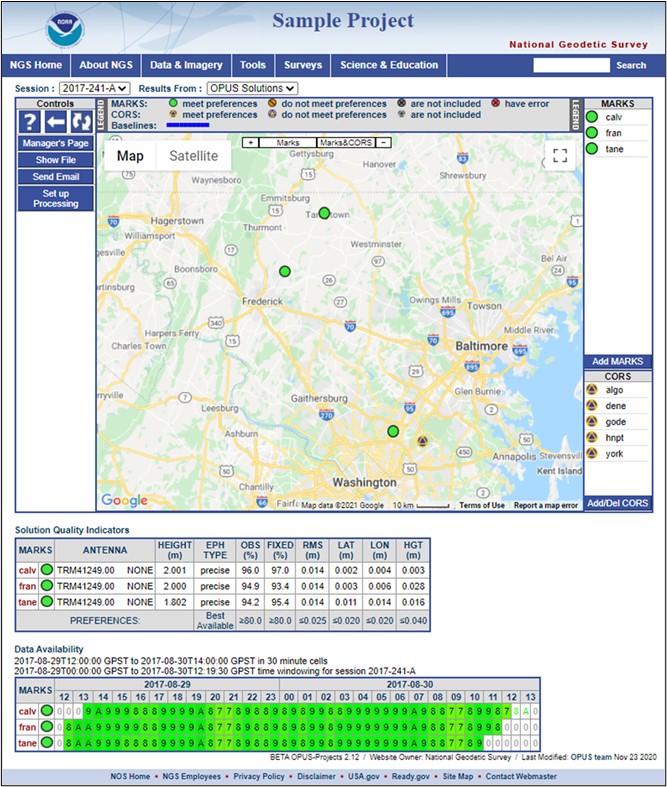
Fig. 7.46 Sessions Page prior to session processing
7.2.1. Solution Quality Indicators
Below the map, near the bottom of the web page is a table listing selected solution quality values for all user marks in this session.
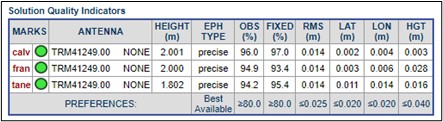
Fig. 7.47 Solution Quality Indicators
The values are checked against the projects solution quality thresholds. Any value that fails to meet its preference threshold is flagged with an orange background color and border, and the marks icon is updated to reflect this condition. In Fig. 7.47, the Solution Quality Indicators are shown as green open-circle icons with no highlighted cells, indicating that the processing results for this session meet the projects preferences. However, Fig. 7.48 shows that one occupation did not meet the quality threshold for percent ambiguities fixed (threshold was 80%).
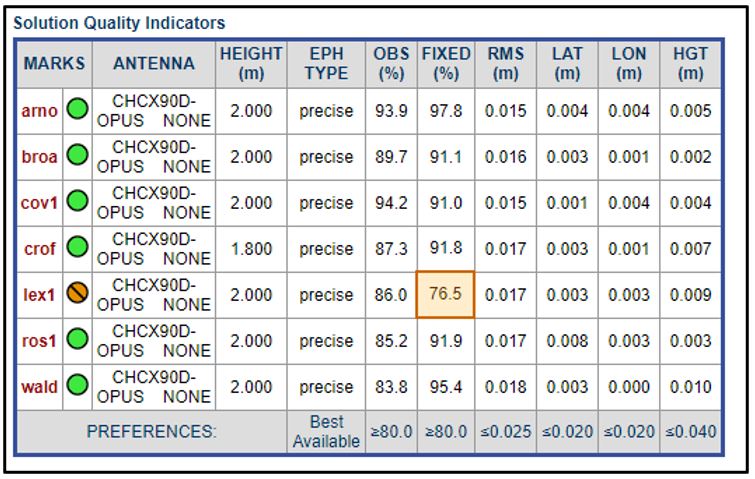
Fig. 7.48 Session solution quality indicators showing a threshold exceeded
7.2.2. Data Availability
The Data Availability table, located at the bottom of the webpage, displays timeline-style graphics that indicate data availability for each user marks data file in a given session, as shown in Fig. 7.49.
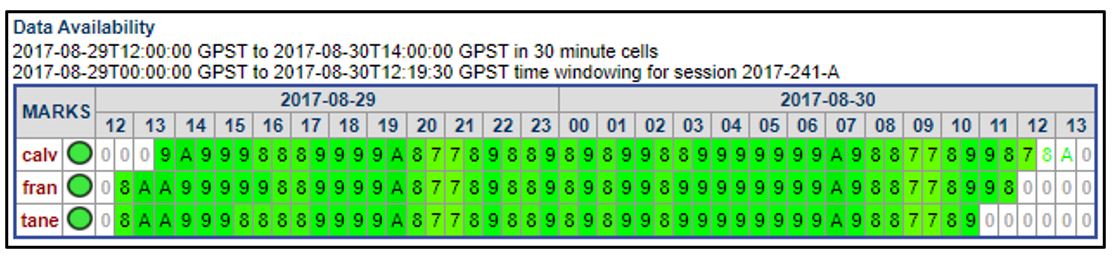
Fig. 7.49 Data Availability table
Each cell in the table represents a time span, with its length displayed in the text above the table, and contains the most common number of satellites tracked during that span. If the number of satellites is greater than 9 (10, 11, 12, …) the cell will contain the hexadecimal representation (A, B, C, …).
The cells in the table are color-coded. Cells with white background and gray characters represent blocks of data that tracked less than four satellites, indicating processing during that time span is not possible. Cells with yellow through dark green background and black characters indicate the availability of four or more satellites, with darker green cells indicating a higher number of tracked satellites. White cells with characters of the same yellow-to-green color scheme indicate observations were available during the represented time spans, but those data are not included in the session. This is less common and only occurs due to time-adjacent sessions that lack a “clean” start/stop time between them or when the user excludes a mark from Session Processing. In such a case, the optimal division between the sessions can cause data from one session to be considered to be part of the other.
7.2.3. Add Marks and CORS
The Add MARKS button functions the same way as on the Manager’s Page. The Add/Del CORS button acts as before, but only affects that particular session, not the entire project. If the user wishes to add or remove a CORS from all sessions, that is best done on the Manager’s Page (see Section 7.1).
7.2.4. Set Up Processing
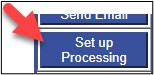
Fig. 7.50 The Set up Processing button on the Session page Controls bar
Clicking the Set up Processing button, as shown in Fig. 7.50, on the Session page Controls bar allows the user to set up the sessions processing parameters. Session processing creates baseline solutions between the hub and each of the selected CORS, as well as between the hub and the user marks. Session processing enables the user to ensure that the project has the correct data for a successful set of Network solutions (Section 12). For more information on Session Processing, see Section 11.