8.2. Selecting Appropriate CORSs for Successful Processing in OP
The following steps will ensure a set of the highest-quality CORS to control your GNSS project. This is especially important if your results are to be submitted to NGS.
8.2.1. Candidate CORSs
Tabulate a list of approximately 6 to 15 “candidate” CORSs for potential use as control in the GNSS survey project. Typically, you should start with the CORSs that get automatically added to your project when you load GNSS observation files through the OPUS file upload portal. These are found on the Managers Page, to the lower right of the Project Map, as shown in Fig. 8.4.
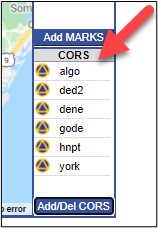
Fig. 8.4 List of all CORS included in the project as seen on the Manager’s Page
It is also good practice to identify these candidates prior to the survey campaign. This can be done by entering the location of the centroid of your project on the CORS map. The map will automatically draw a 250 km radius around your identified location (city, ST or lat, long) and list the (up to 20) CORSs found within the circle (shown in Fig. 8.5).
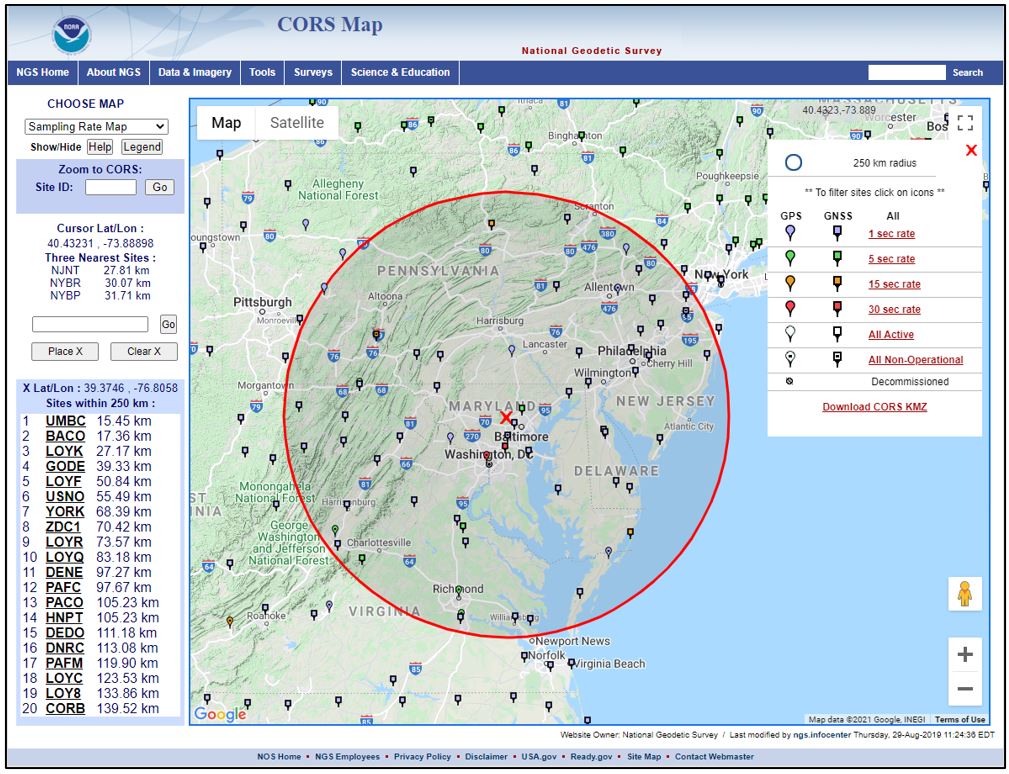
Fig. 8.5 Map of CORS stations on the CORS web page, showing a 250 km radius around a selected location
Planning and studying the CORSs prior to the survey will prevent the blind belief that particular stations are functioning properly or operational during the survey (which unfortunately is not always reality). Your regional geodetic advisor is also a great resource to help you select appropriate CORSs for your project.
Tip
To help in the selection of CORSs, it may be useful to construct a spreadsheet to track the important characteristics of each CORS you are considering
It may be helpful to create a spreadsheet to track some of the important variables for each CORS that you are considering. An example of this kind of tracking system is shown in Fig. 8.6.
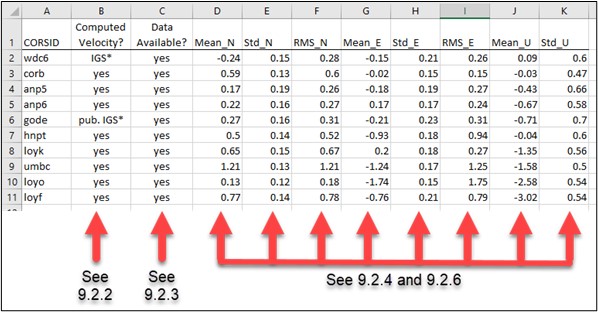
Fig. 8.6 Example of a spreadsheet used to help select the best CORSs for a project
* IGS/published IGS: IGS stations will have computed coordinates and velocities for the latest IGS reference frame.
Choose stations from your list that have data available during the entire survey project (click on the link in the information bubble for the CORS).

Fig. 8.7 Data availability for the CORS “GODE” in early April 2021
Note that Data Availability will only be available for CORSs in the NOAA CORS Network (“NCN”). An example for station GODE is shown in Fig. 8.7. For IGS stations not in the NCN, you will be presented a pop-up window that suggests no data are available, as shown in Fig. 8.8.
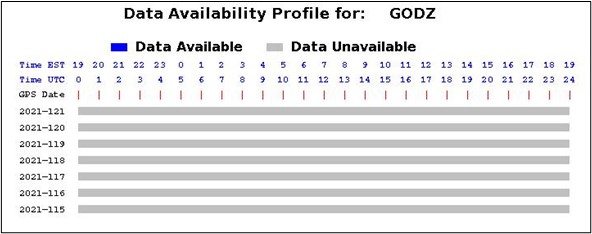
Fig. 8.8 Data availability for a CORS not in the NOAA CORS network will appear blank
Please refer to the IGS for data availability: http://www.igs.org/network. Although perfectly continuous data is ideal, for a variety of reasons, you may end up selecting a CORS with some small data gaps.
Determine which CORSs have computed (i.e., measured) velocities rather than modeled velocities. CORS with computed velocities are tabulated in the “composite coordinate tables” available to download directly at: https://noaa-cors-pds.s3.amazonaws.com/coord/coord_14/itrf2014_geo.comp.txt. The user can also see whether or not a CORS has computed velocities by visiting the Site Info page for the CORS and selecting “Coordinates”, and then “Position and Velocity”. For example, the Position and Velocity for station LOY8 is given in the example shown in Fig. 8.9.
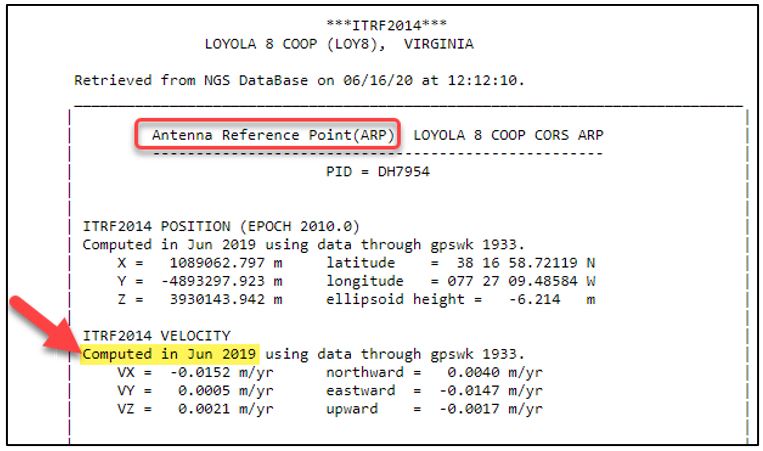
Fig. 8.9 Example coordinates page for the CORS LOY8 showing computed velocities
The yellow highlighted text above shows that the velocities are computed, not modeled. Computed CORS velocities are preferred because their velocities are measured from several years of continuous observations. Modeled CORS have velocities estimated from the Horizontal Time-Dependent Positioning (HTDP) utility, which in most cases ignores vertical motion.
Note that the example above for LOY8 shows the position and velocity with respect to the Antenna Reference Point, or ARP (circled in red). Some CORS will also provide coordinates with respect to the “Monument”, or “MON”,as shown in Fig. 8.10, which in all cases is closer to the ground than the ARP. Not all CORSs will have a MON, but all CORSs will have an ARP. OPUS Projects will always use the lowest reference point, so, in the case of the CORS GODE in the example below, OP will use the coordinates from the MON.
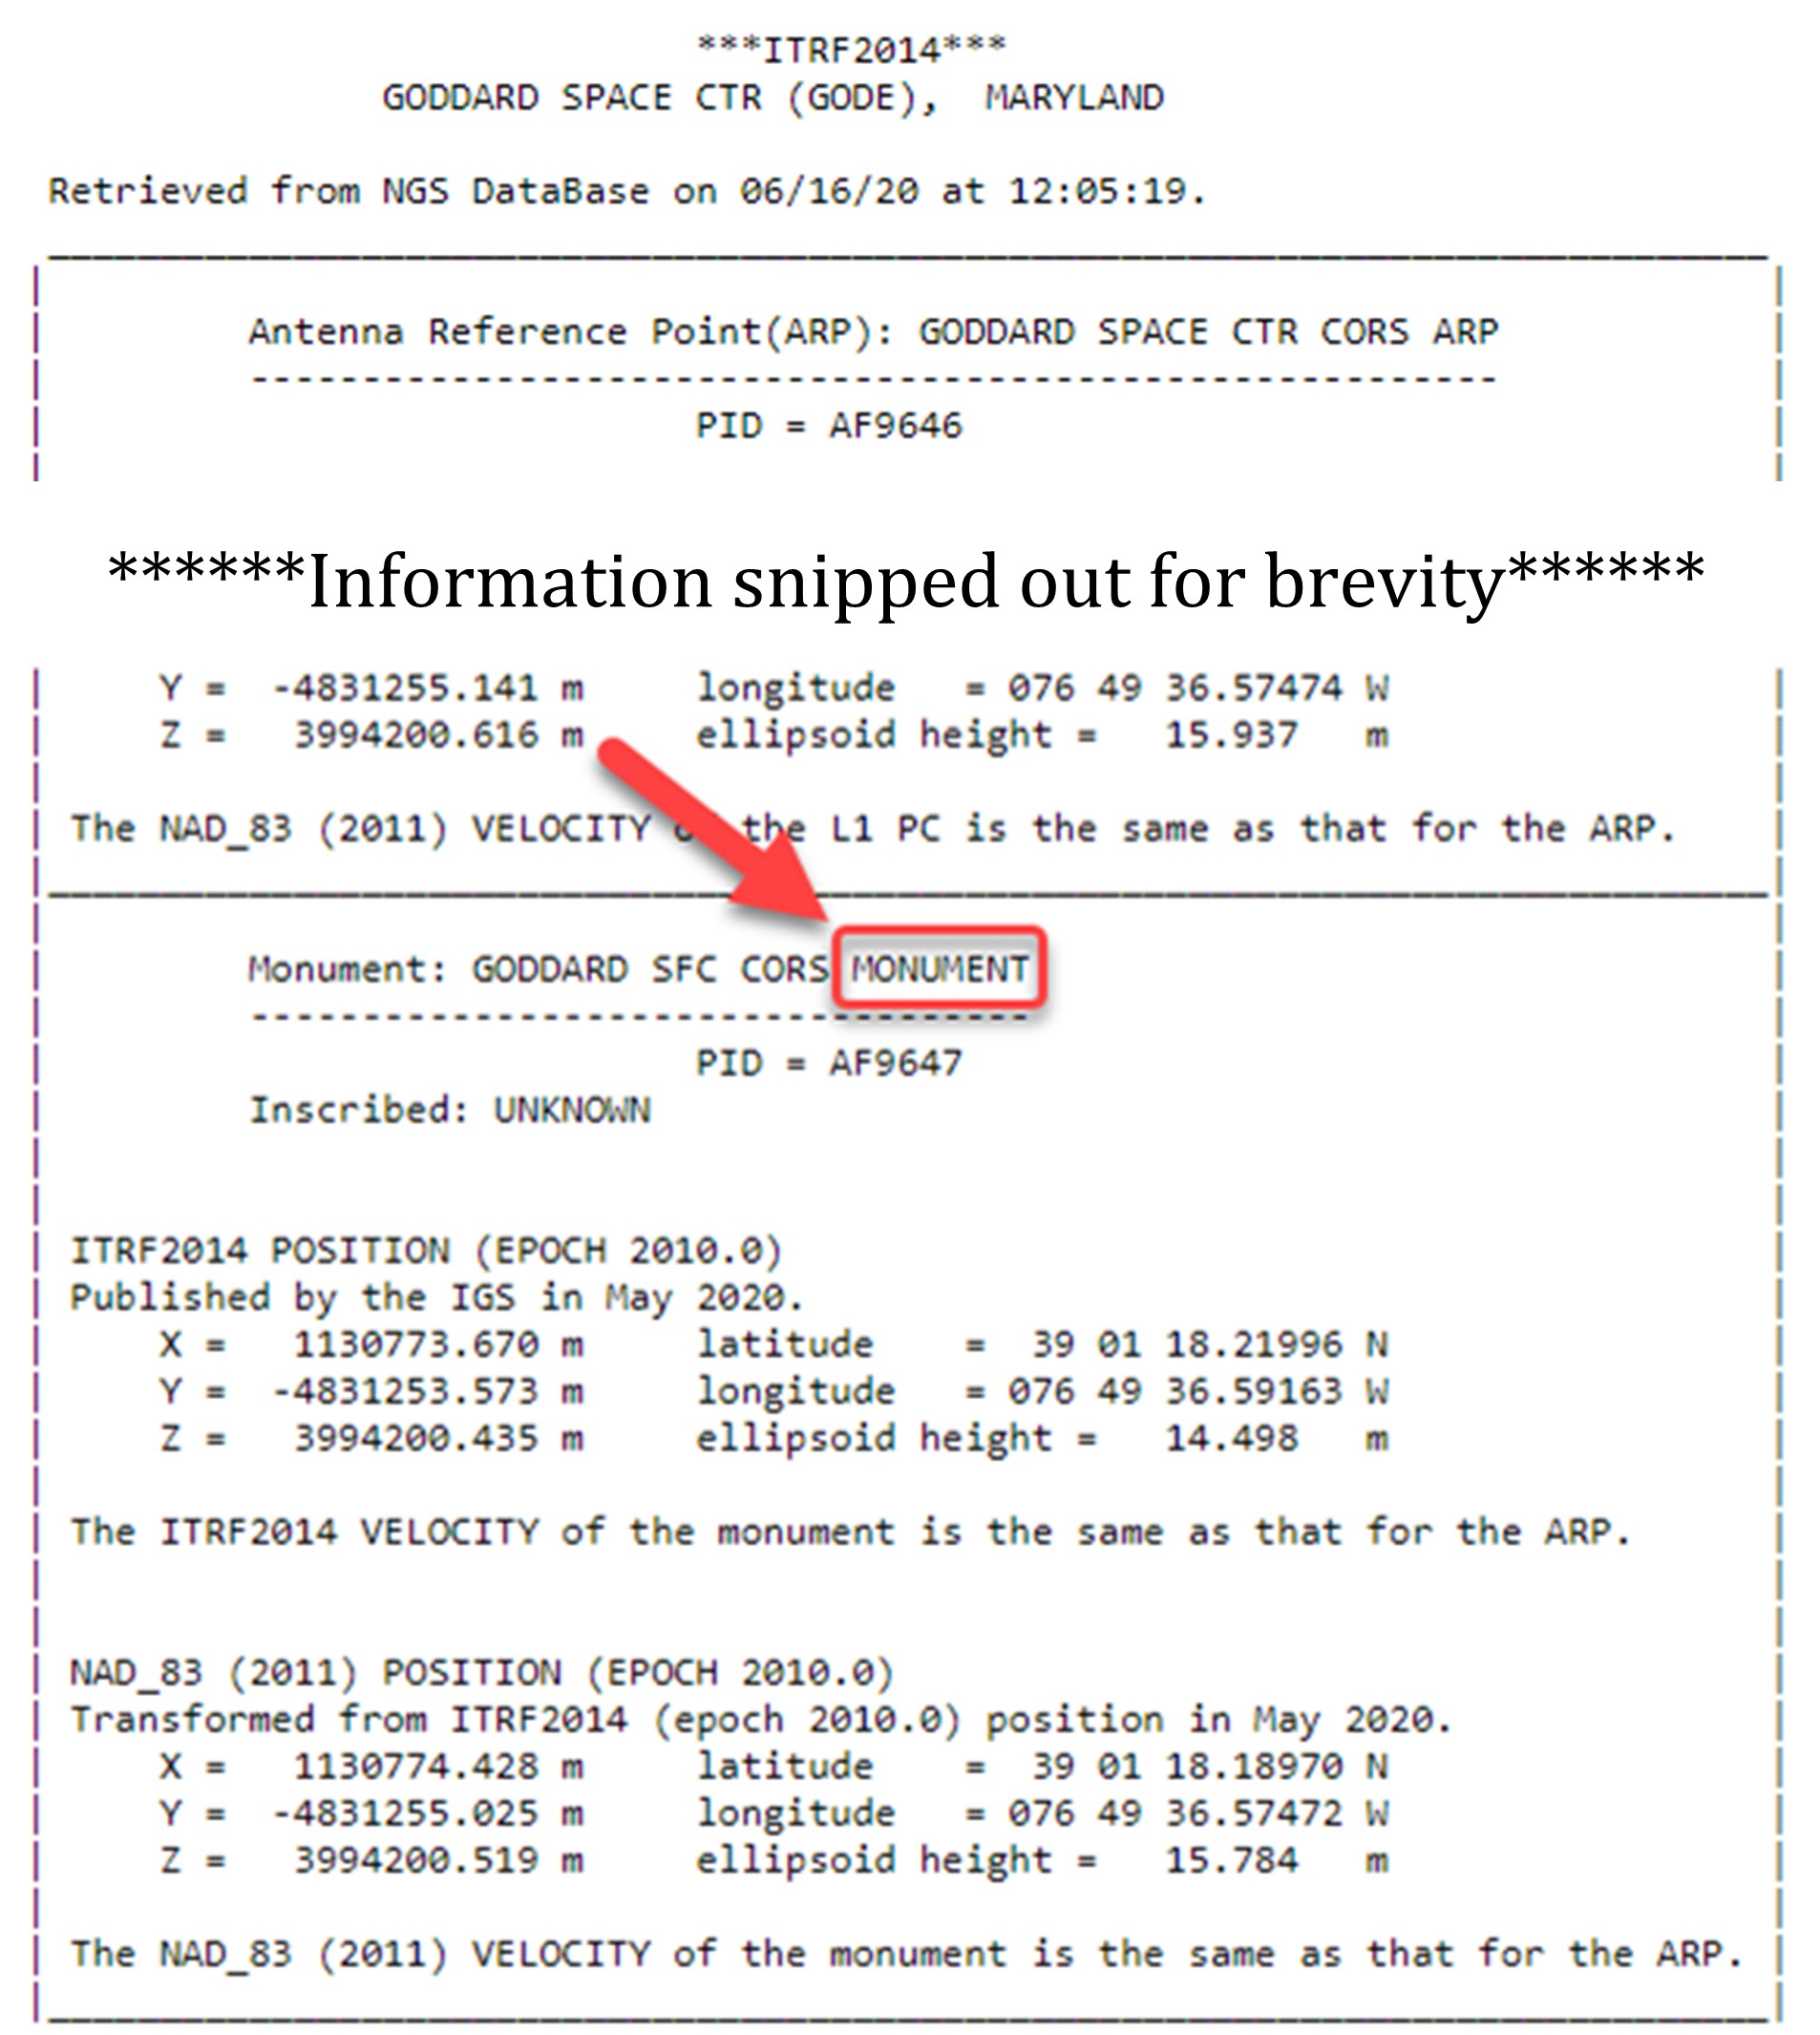
Fig. 8.10 Example of a CORS coordinates page showing reference to the CORS monument
One way to tell which coordinates OPUS uses is to click on the CORS icon on the map (e.g. Managers Page): the information bubble will reveal which is the reference point used. The example shown in the information bubbles below (Fig. 8.11 and Fig. 8.12) show two different CORSs in the project, one referencing the MON (GODE) and the other referencing the ARP (HNPT).
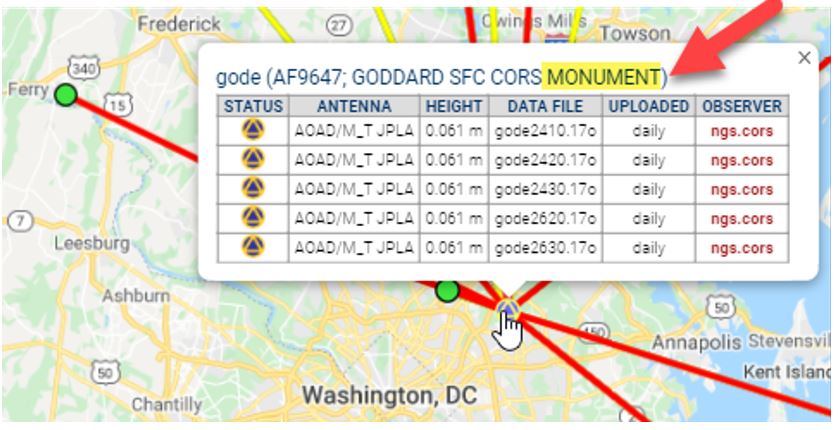
Fig. 8.11 Example of a CORS position referencing the monument
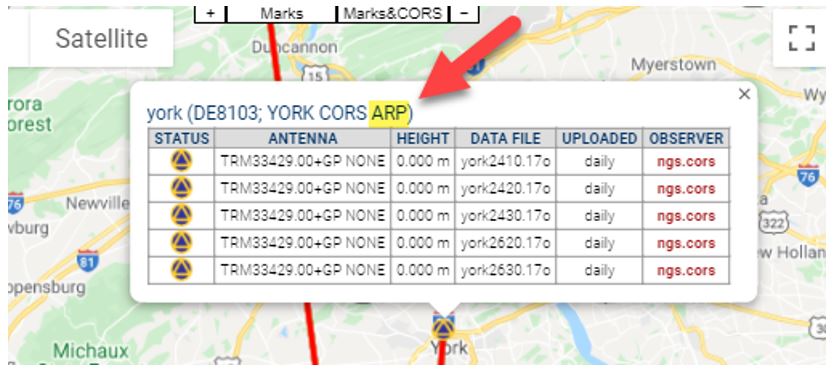
Fig. 8.12 Example of a CORS position referencing the Antenna Reference Point (ARP)
The best CORSs have network accuracies estimated to be less than 3 cm in ellipsoid height and 1.5 cm horizontally (95% confidence). Network accuracies are given on the datasheet for the given CORS, as example is shown in Fig. 8.13. Note: some CORSs have very poor network accuracies (on the order of several cm). Such CORSs should be avoided for use as control whenever possible.

Fig. 8.13 CORS network accuracy shown on the station’s datasheet
8.2.2. Distance Considerations
Ideally, at least 4-5 CORSs will meet the above characteristics and all lie within 250 km of the center of the project area, as shon in Fig. 8.14. These CORSs will be used to control the project.
One of these CORS will also serve as the “hub,” meaning that the CORS is preferentially selected for inclusion in baselines. In other words, all marks (user marks and CORSs) that are not hubs will have a direct baseline connection to the nearest hub. The hub should be centrally located, and lie no more than 100 km away from all user marks in a session. Often, a single station can serve as the hub for the entire project. However, if the project spans large distances such that the 100 km rule cannot be maintained, then multiple hubs will be needed. The same station(s) serving as hub(s) should be designated in each session (see Section 11).
At a very minimum, there should be one hub and at least one other CORS controlling the project. If there are not enough stations meeting the criteria explained in the steps above, the user will have to look outside the 250 km radius.
For tropospheric decorrelation, a distant CORS lying >375 km, but < 800 km is required. The same characteristics as above hold.
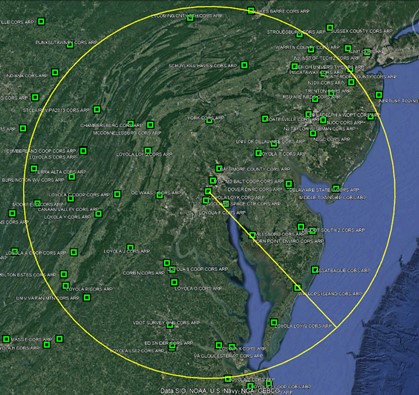
Fig. 8.14 Example of CORSs plotted with respect to a 250 km radius from the centroid of the project
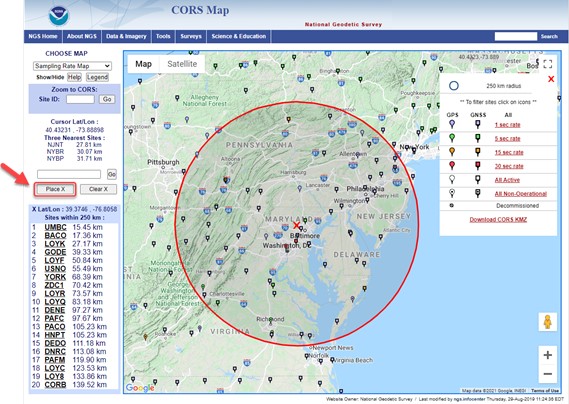
Fig. 8.15 CORS map showing CORSs plotted with respect to a 250 km radius from the centroid of the project
If using the CORS map (https://geodesy.noaa.gov/CORS_Map/), the map will draw a 250 km radius circle around the location you have identified by placing the “X” provided by the button “Place X”, as shown in Fig. 8.15. Candidate CORSs within the circle could serve as project CORS including the hub during session processing. Plan which CORS will function as the hub for each session. Often, a single station can serve as the hub for the entire project. At a very minimum, there should be one hub and at least one other CORS controlling the project. If there are not enough stations meeting the criteria explained in the steps above, the user will have to look outside the 250 km radius. If the project spans a large area (e.g. more than 500 km), you may need to draw 250 km circles at opposite ends of the project area, and choose more than one hub.
Stations outside the 250 km radius, between 375 km and 800 km, can serve as the “distant” CORS. Distant CORS should not be held as control; rather, they are used to de-correlate the wet component of the tropospheric delay modeling within OP. Consider choosing an IGS station within this zone.
Tip
Due to lack of CORS availability in remote locations, it may be necessary to choose a long distance CORS that exceeds the 800 km distance recommendation
Caution
OP will automatically suggest a CORS to be used as a hub. In most cases, this hub will meet the recommended selection criteria
8.2.3. Data Quality Check
Once a list of candidates has been compiled, download and save their short-term time-series plots. NGS produces these plots for every CORS, but only provides to the public the most recent 90 days. It is best practice to download these plots about 45 days after the middle session of the survey project. In this way, the time-series plot is now “centered” over the time period of the survey project.
Caution
If using OP to process data more than 90 days old, the user will not have access to the corresponding CORS short term plots, and will have to use alternative methods to evaluate short term CORS behavior (e.g. download daily files from the CORS web page)
Using the centered time-series plots, select the candidates with RMS (in northing, easting, and up) less than 2 cm. Candidates with large spikes, data gaps, or discontinuities should be rejected. Selecting candidates in this manner will provide some assurance that the published coordinates and velocities at the CORS are in agreement with the daily solutions for the CORS.
The best CORSs should have “consistent” data depicted in 90-day short-term time-series plots. NGS processes each day of GNSS data collected at each CORS and plots the differences between the resulting coordinates and the published coordinates on short-term time-series plots (in terms of delta northing, easting, and up). These plots can be accessed for every CORS at: https://geodesy.noaa.gov/corsdata/Plots/. CORS with plots that depict significant biases from the published coordinates (more than 2 cm in northing, easting, or more than 4 cm in up), spikes, or data gaps should be avoided.
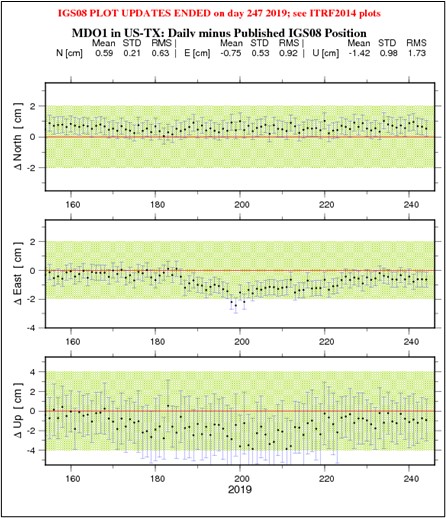
Fig. 8.16 Example of a CORS short-term plot showing both bias and random error
A 90-day short-term time-series plot for CORS MDO1 is shown in Fig. 8.16. The solid red horizontal line represents zero deviation from the published coordinates (northing, easting, up). The black dots (with error bars) represent the residual difference between the daily solution and the published coordinates at the CORS. In this example, scatter and residuals are negatively biased in the up direction, evidence that the published coordinates are somewhat higher than the daily solutions. It also shows some deviation in the easting around day of year 200 (July 19), indicating this CORS would not be reliable as control during that time. The mean, standard deviation (STD), and root-mean-square error (RMS) of the daily residuals depicted in this figure (in northing, easting, and up) are also provided as text at the top of the figure; these statistics are helpful for summarizing the repeatability of the data for the CORS.
Fig. 8.17 is an example of a short term CORS plot for MNBV which shows less bias and lower error, especially in the up direction.
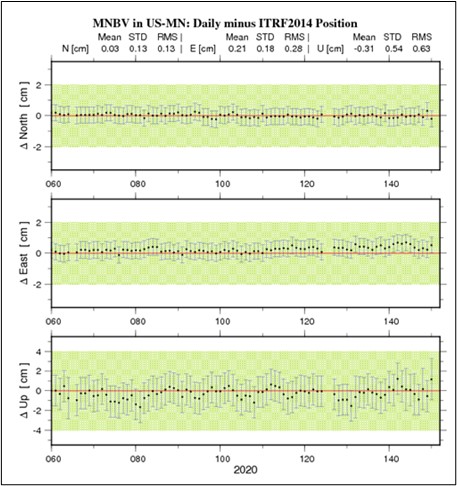
Fig. 8.17 Example of a short-term CORS plot exhibiting little bias and low error
8.2.4. Select the Hub
From within the 250 km radius of the user marks, select one candidate to function as the hub for each session. In most cases, the same hub should be used for every session in a survey project. It must be within 250 km of all user marks in the session. Note that for large survey projects where the user marks cover an area greater than 500 km in diameter, it may be necessary to designate more than one CORS to function as a hub for a particular session.
Tip
If questions remain about the suitability of CORS/IGS stations in a given region, consider reaching out to your NGS Regional Geodetic Advisor for guidance
As part of the error-reducing post-processing of GNSS data using the CORS, the moisture content of the troposphere through which the GNSS signals traverse needs to be modeled. The tropospheric model is parameterized using information from the CORSs selected to control the project. If most CORSs are located close to the project, the GNSS signals are all altered/delayed by the same amount, since they all see essentially the same troposphere. This can cause biases in the tropospheric model. This bias can be removed by including a distant CORS in the project.
Therefore, the user must select one distant CORS for tropospheric decoupling. This CORS should be between 375 km and 800 km from the center of your project and have data available for each of the sessions. Typically only one distant CORS is needed. Similar rules apply to selecting this CORS as with the other CORSs selected in the project. In addition, it is recommended to verify that there wasn’t any extreme weather at this distant CORS (i.e., lightning storms, hurricanes) by checking weather data in that area coinciding with the dates and times of the survey. Extreme weather or passing weather fronts can adversely affect session baseline processing solutions.
In CORS-sparse areas, baselines may be longer by necessity, which may satisfy the tropospheric modeling without having to add an additional long-distance CORS. Likewise, if a network spans more than 250 km a long distance CORS may also be unnecessary.
Tip
The “distant CORS” can either be part of the NOAA CORS Network, or an IGS station available in OP.
Once you have selected the CORSs for your project (typically about 4 or 5, plus the distant CORS) any CORS that will not be used should be removed from the project.