
Multi-Year CORS Solution 2 (MYCS2) Coordinates
On January 29, 2017 (GPS week 1934), the International GNSS Service (IGS) released the new coordinates and corresponding antenna calibrations in the IGS realization of the International Terrestrial Reference Frame 2014 (ITRF2014). As part of this transition, products in the IGS08 frame are no longer updated. Instead, all the updates will be in the ITRF2014 frame.
Although NGS did not participate in the 2nd IGS reprocessing campaign, we have completed the reprocessing of the NCN and IGS Network stations. The newly reprocessed solution, called the Multi-Year CORS Solution 2 (MYCS2), is aligned to the ITRF2014 frame. MYCS2 supersedes the previous reference frame and realization, which was released in 2011 under the name MYCS1. The final alignment of our No-Net-Rotation (NNR) SINEX files to ITRF2014 used 496 solutions from 194 ITRF2014 stations, not including any of the 26 IGS stations with post-seismic behavior. The MYCS2 generally implemented the International Earth Rotation Service (IERS) 2010 conventions.
NGS' 2nd Reprocessing Campaign
Since the MYCS1 IGS08 coordinates and velocities were released in 2011 there became a need for the new and updated coordinates and velocities due to the following changes:
- Geophysical processes (earthquakes) in some areas, e.g., the coastal earthquake of southern Alaska (M7.5, depth=10.0 km) on 2013:005, Napa valley earthquake (M6.0, depth=11.1 km) on 2014:236 and more than a dozen other earthquakes in Alaska, offshore British Columbia, Chile, New Zealand and the Southern Pacific.
- Equipment changes, especially hundreds of instances of antenna changes not reported to NGS by partners, all caused noticeable jumps in the time series. In one example, the antenna changes for over 50 stations in one statecaused 3-4 mm jumps in the East residual time series, slightly less in the Up residuals, and no jumps in the North residuals. Discontinuities (jumps) due to antenna (and on rare occasions receiver firmware) changes generally range from a few mm to several centimeters.
- Hundreds of new NCN stations have been installed and 6 more years of data has been collected since 2011. For example, most stations in Iowa, which did not exist in MYCS1, now have a time series as long as 3 years. Also, most Alaskan time series are around ten years long in MYSC2 but were only a few years long in MYSC1.
- Spikes in Alaskan and other similar time series later identified as due to snow accumulation, which contaminated the MYCS1 solution, have been deleted from the MYCS2 solution.
- A new international reference frame was released (ITRF2014). MYCS2 positions and velocities refer to ITRF2014, epoch 2010.0.
- The IGS adopted some geophysical model updates since the release of MYCS1, such as the IGb08 reference frame model and updated IGS08 absolute antenna calibrations, and a few changes to the IERS 2010 model conventions: the ocean tide loading and the second order ionospheric effect.
MYCS2 Processing
The processing included data spanning 1996 to 2016 (week 0834 to 1933), 1100 weeks or 21 years in total. The processing involved around 3050 NCN, IGS Network and other (e.g., NGA) stations. This was a massive computation effort, with the input and output data occupying about 25 TB. Although NGS has NCN data from the early 1990s, the residual time series showed exceptionally noisy behavior and so those data were not included in the alignment/velocity computation stage.
The processing was done in 3 steps:
1. The Global processing step solves for orbits, Earth Orientation Parameters (EOPs), hourly tropospheric delay parameters and weekly global (IGS) station positions in an IGS-NNR frame.
2. The NCN processing, tying the remaining NCN stations to global, backbone stations holding fixed estimated orbits, troposphere, EOPs and IGS station coordinates. This leads to estimated CORS coordinates in an NNR frame.
3. Alignment of the estimated coordinates with ITRF2014 and velocity estimation. This process was done in 16 iterations to achieve rigorous quality control and discontinuity detection. The first iteration started with the MYCS1 discontinuity and data deletion lists. Consecutive iterations ran an automatic edge detection algorithm based on the criterion of minimal mechanical energy (Blake and Zisserman, 1987), detected discontinuities and outliers were added to the corresponding files which were used in the following iteration. Accounting for every existing discontinuity is critical, missing of a single discontinuity at a single station could corrupt the velocity estimates of an entire region surrounding the station. The final iteration included feedback from users after the BETA product release.
Criteria for Publishing Coordinates
CORSs’ positions vary over time with at least an annual and semi-annual variation. For this reason velocities cannot be rigorously estimated until 3 years of data or 156 weekly solutions are analyzed. Therefore the published positions and velocities for stations with more than 3 years of data and 156 weekly solutions are computed from our stacked solution- with some few exceptions (i.e. geophysically active areas or low standard deviation stations). For the other stations, mostly new(er) stations, we compute a position but assign a modeled velocity. The velocity is modeled and obtained using the Horizontal Time Dependent Positioning (HTDP) software. The current velocity models address only the 2-dimensional horizontal components and a 0 (zero) velocity is assigned for the vertical component. Since the modeled velocities may not reflect the actual long-term motion of a CORS and it may take some time to robustly estimate the velocity directly from the data, it is clearly identified that the source is either computed or modeled.
Main Changes From Previous Reference Frames
Change in Reference Epoch
The new reference epoch for the IGS frame has changed by 5 years from 2005.00 to 2010.00. However, the published NAD83 coordinates epoch is unchanged at January 1 2010 (or equivalently, epoch 2010.00). If a position at a different time is required then the published velocity must be applied and a new position computed. Although a more recent epoch will have less systematic errors due to error budget of the published velocity estimates, the decision has been made to have the same epoch between IGS and NAD frames. Therefore, users must take special note that CORS coordinate functions defined in ITRF2014 and NAD83(2011, MA11, PA11) differ with respect to those defined in IGb08, and the NAD83 will only have position/velocity updates.
| Number of stations with solutions | Number of stations with computed velocities | |
|---|---|---|
| MYCS1 | 2118 | 1337 |
| MYCS2 | 2626 | 2393 |
In summary, MYCS2 shows improved overall velocity uncertainties mostly due to much longer time series than MYCS1. We have computed velocities for 2393 stations which includes 987 additional stations since MYCS1. However, 233 stations still need longer time series or better quality to obtain velocities.
Velocity Fields Relative to ITRF2014
Horizontal Velocity Field (50 km x 50 km gridding)
Linear velocities for all stations are estimated in the NGS realization of ITRF2014. Unless an earthquake or a post seismic adjustment occurred, the velocities of a station in between discontinuities are constrained to have the same value. Stations that experience earthquakes, post-seismic adjustment and in a few cases, non-uniform vertical motion, are allowed to have different velocities in between events as dictated by the data. The following two figures present 5’x5’ grids of the estimated horizontal and vertical CORS velocities. As expected, these velocities are fairly smooth. Except in and around California, the horizontal velocities are predominantly (to within 1-2 mm/year) dictated by the rotation of the North American (NA) tectonic plate on the surface of the “spherical” earth. On the plate boundary, in and around California, and in southern Alaska, the velocity is caused by a combination of the rotation of the NA plate and the interaction between the NA and the Pacific/Juan de Fuca plates.
Vertical Velocity Field
The vertical velocity field is also smooth, pointing mostly to a subsidence of 1-2 mm/year. In addition, an uplift of a few mm/year due to glacial isostatic adjustment (GIA) in the North East and significant subsidence in southern Louisiana, the Houston/Galveston area of Texas and Central California are identified.
It should be noted that, unlike horizontal velocities, most vertical velocities are smaller in magnitude than their estimated errors. The vertical velocity errors of a station of good quality with only three years of consecutive data is about 6 mm/year. For the same station with 6 years of data, the uncertainty is around 2 mm/year. It takes a time series of around a decade in length to obtain velocity errors of 1 mm/year. The magnitude of most estimated vertical velocities is 1-2 mm/year.
MYCS2 vertical velocities in North America on a 5x5 minutes grid using a nearest-neighbors weighted mean. The only filter applied is to exclude all stations with standard deviation (SD) of the vertical velocity is > 8 mm/year (which roughly correspond to 2.5 years of observations). In addition, 2 stations in Mexico are removed, which have vertical velocities of -264 mm/year and -26 mm/year. These were removed since Mexico has only a few stations. If these 2 stations were left in, the entire area of Mexico would falsely appear to subside by 10-12 mm/year.
MYCS2 Vertical Velocity Field
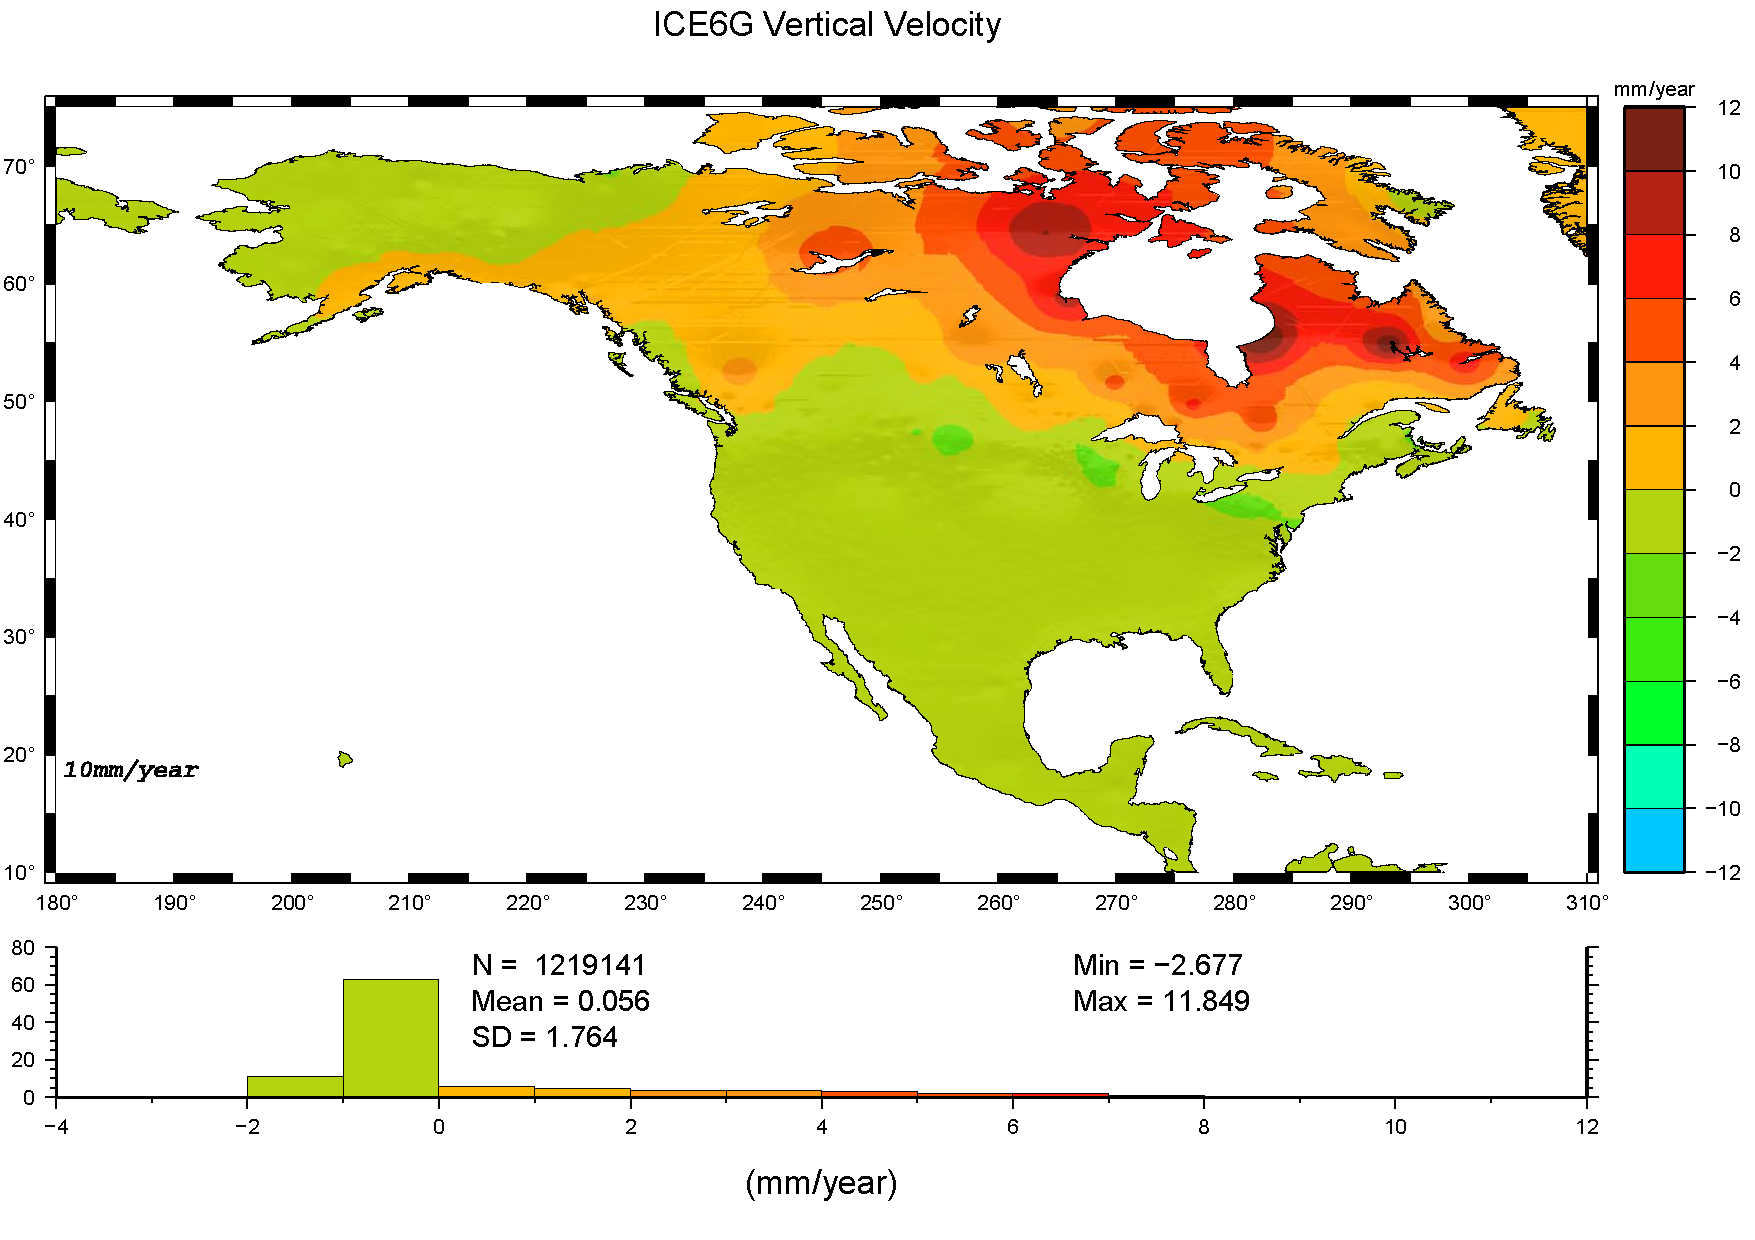
GIA (ICE6G model) predicted vertical velocity.
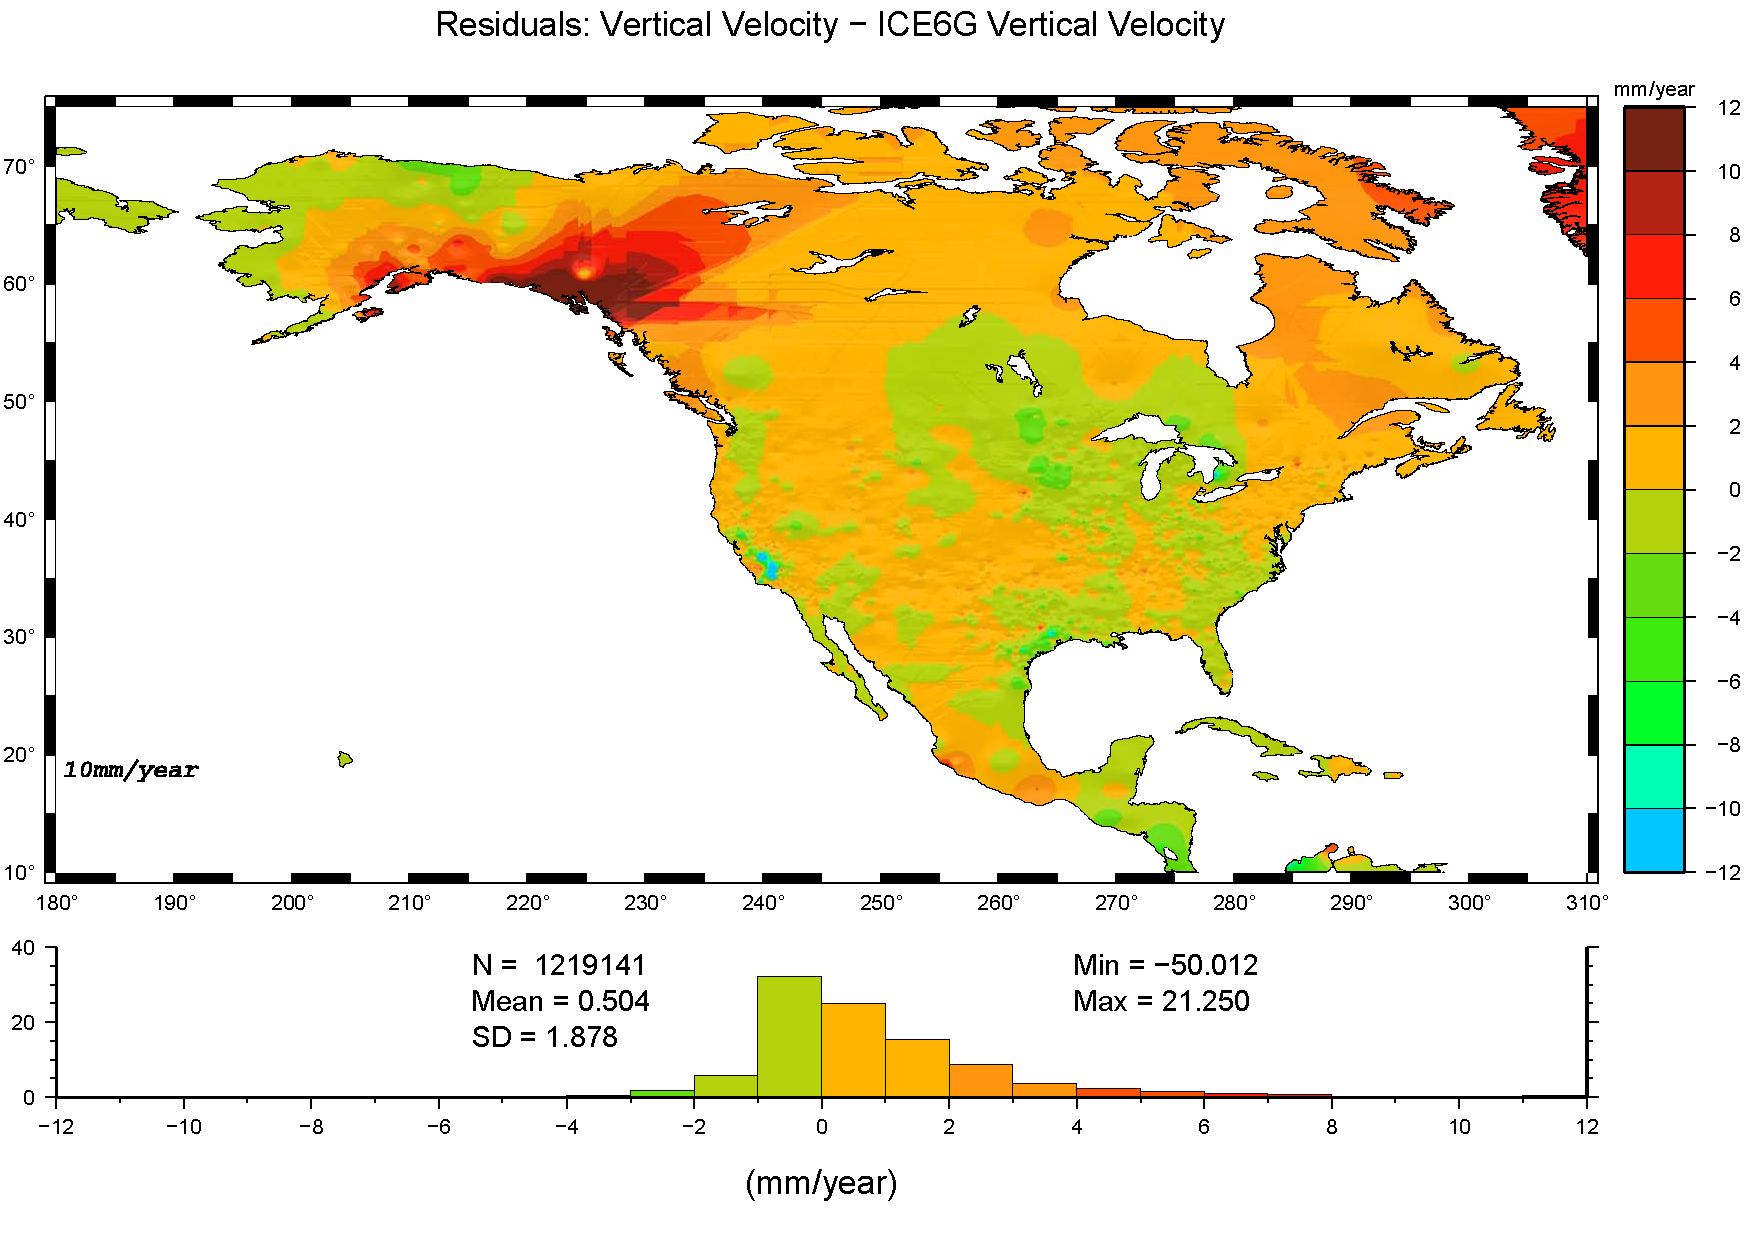
Residual vertical velocities: MYCS2 - GIA. Notice how (1) and (2) correlate highly in Canada but not in the US.
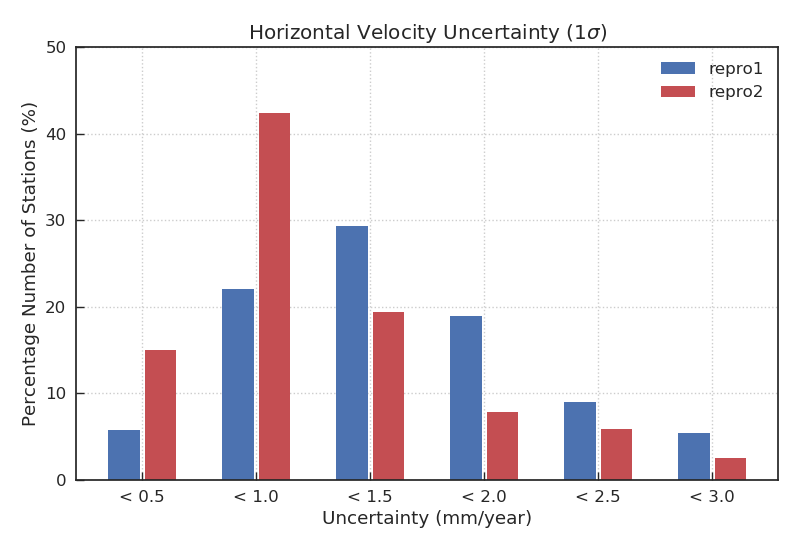
Velocity Uncertainties
Horizontal and vertical velocity uncertainties are shown in the map. In terms of magnitude, vertical velocity uncertainties are generally 3 times bigger than horizontal velocity uncertainties.
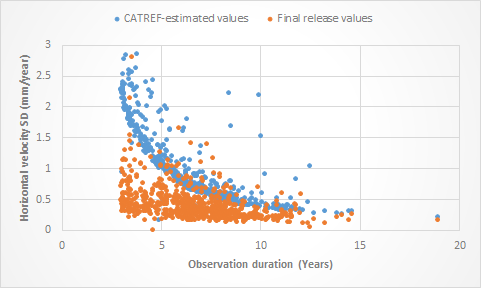
The following plots present the vertical and horizontal velocity uncertainties as a function of observation duration for ~800 undisturbed stations (stations which have not experienced any man-made or natural discontinuities of data recording). The blue dots describe the velocity uncertainties that were computed automatically by the software (CATREF) used in this reprocessing.. These values do not take into account atmospheric and underground water loading and assume the data noise to be purely white (time-uncorrelated) noise. The brown dots present our calculation of more realistic velocity uncertainties, which consider and remove loading effects and take into account time-correlated noise that is surely present in the data. Our final data release is represented by the brown dots. Consequently, three years of continuous observations will result in vertical velocity uncertainty of about 1.0 mm/year (not 7 mm/year) and horizontal velocity of about 0.7 mm/year (rather than 2.5 mm/year).
NAD83(2011) Coordinate Changes
The ITRF2014 coordinates of all computed CORS coordinates from MYCS2 processing are converted to NAD83(2011) using HTDP. The resulting NAD83(2011) coordinates are then compared to those obtained from MYCS1 at all common stations. The coordinate differences are compared at epoch 2010.0 (MYCS2 - MYCS1). The differences are less than 5 mm in most areas with some exceptions. The largest differences are seen in southern Alaska. Other visible changes are seen in areas of significant and real subsidence and in places where the time series are too short, such as in Iowa where almost all time series are 3 years long. Vertical coordinates (ellipsoidal heights) are compared using the same criteria. The stations with the HTDP estimated velocities from MYCS1 (no vertical velocities) show the largest differences. In addition, non-secular subsidence areas also show larger differences.
NAD83(MYCS2) - NAD83(MYCS1) Horizontal Position Differences
NAD83(MYCS2) - NAD83(MYCS1) Vertical Position Differences
Coordinates and Velocities of the Antenna Reference Point (ARP) of All Processed Stations
Below are text files contain coordinates and velocities of the ARP of NCN stations processed in MYCS2. In which:
- Computed files contain stations, each of which provides equal or more than 2.5 years of solutions in our MYCS2, and provides at least 130 weekly solutions.
- Modeled file contain stations, each has operated for less 2.5yrs and/or provided less than 130 weekly solutions in our MYCS2. New NCN stations are included in these files.
In general, each file is a CSV file (ASCII format) containing several header lines and station records. Each line being a record referring to a specific station. Header lines contain station ID, coordinates and velocities of the ARP, country, state codes, and the current operational status in the NCN. The station operational status is either:
- Operational: currently providing data,
- Non-Operational: has not provided data for at least 30 consecutive days,
- Decommissioned: has stopped operating permanently or was removed from NCN,
- IGS_not_CORS: IGS stations, for which NGS does not store data on its servers.
| Computed | Modeled | |||
|---|---|---|---|---|
| Cartesian | Geodetic | Cartesian | Geodetic | |
| ITRF2014 All processed stations |
Download | Download | Download | Download |
| NAD83(2011) Stations in CONUS, Alaska, Puerto Rico, U.S. Virgin Islands |
Download | Download | Download | Download |
| NAD83(PA11) Stations in U.S. islands on the Pacific plate |
Download | Download | Download | Download |
| NAD83(MA11) Stations in U.S. islands on the Mariana plate |
Download | Download | Download | Download |
Other methods to obtain NCN coordinates and velocities can also found at: NCN Data & Products page.
Helmert Parameters Used in Transforming Coordinates from ITRF2014 to NAD83
For historical Helmert transformation parameters used at NGS, visit Helmert Transformation Parameters page.
The NGS utility Horizontal Time-Dependent Positioning (HTDP) uses the following Helmert parameters along with crustal motion models to transform between ITRF2014/IGS14/IGb14 and the three NAD83 reference frames. Because crustal motion models are part of the transformation process, using the Helmert parameters by themselves generally will not yield correct results if the input and output epochs are not the same. In other words, these parameters alone are not guaranteed to correctly transform to NAD83 at epoch 2010.00 if the input ITRF2014/IGS14/IGb14 coordinates are at any epoch other than 2010.00.
| Parameters t0 = 2010.0 |
Definition | Unit | From ITRF2014/IGS14/IGb14 To | ||
|---|---|---|---|---|---|
| NAD83(2011) | NAD83(PA11) | NAD83(MA11) | |||
| Tx(t0) | x-translation | meters | 1.00530 | 0.9109 | 0.9109 |
| Ty(t0) | y-translation | meters | -1.90921 | -2.0129 | -2.0129 |
| Tz(t0) | z-translation | meters | -0.54157 | -0.5863 | -0.5863 |
| εx(t0) | x-rotation | mas | 26.78138 | 22.749 | 28.711 |
| εy(t0) | y-rotation | mas | -0.42027 | 26.560 | 11.785 |
| εz(t0) | z-rotation | mas | 10.93206 | -25.706 | 4.417 |
| s(t0) | scale | ppb | 0.36891 | 2.12 | 2.12 |
| T'x(t0) | x-translation rate | meters/year | 0.00079 | 0.0001 | 0.0001 |
| T'y(t0) | y-translation rate | meters/year | -0.00060 | 0.0001 | 0.0001 |
| T'z(t0) | z-translation rate | meters/year | -0.00144 | -0.0019 | -0.0019 |
| ε'x(t0) | x-rotation rate | mas/year | 0.06667 | -0.384 | -0.020 |
| ε'y(t0) | y-rotation rate | mas/year | -0.75744 | 1.007 | 0.105 |
| ε'z(t0) | z-rotation rate | mas/year | -0.05133 | -2.186 | -0.347 |
| s'(t0) | scale rate | ppb/year | -0.07201 | 0.11 | 0.11 |
|
where:
|
|||||
Equations Used in Transforming Coordinates from ITRF2014 to NAD83
The equations given below transform ITRF2014 positional coordinates (xITRF2014, yITRF2014, zITRF2014) with an epoch date at time t to NAD83 positional coordinates (xNAD83,yNAD83, zNAD83) at the same epoch date. Positional coordinates for a different epoch date (and for a particular reference frame) can only be obtained by knowing the velocity (time rate of change) of the point in the same reference frame. HTDP includes models that estimate these velocities, allowing transformation of coordinates at different epochs and between several commonly used reference frames.
| xNAD83 | = | Tx(t) | + | [1 + s(t)] · xITRF2014 | + | εz(t) · yITRF2014 | - | εy(t) · zITRF2014 |
| yNAD83 | = | Ty(t) | - | εz(t) · xITRF2014 | + | [1 + s(t)] · yITRF2014 | + | εx(t) · zITRF2014 |
| zNAD83 | = | Tz(t) | + | εy(t) · xITRF2014 | - | εx(t) · yITRF2014 | + | [1 + s(t)] · zITRF2014 |
where:
|
||||||||
