Colorado 1 cm Geoid Experiment
Additional Documentation
NGS has made available a number of different datasets in support of the International Association of Geodesy Working Group 2.2.2: The 1-cm geoid experiment during the 2015-2019 term. These datasets were used as input for a regional geoid comparison over the Colorado region made by 14 international groups (see Wang et al 2021 for summary). These datasets are made publicly available for additional and future geoid modeling research. Please see the Read Me file for more information.
Input Datasets:
- Terrestrial Gravity (3 MB)
- GRAV-D Airborne Gravity Data (21 MB)
- Global Gravity Model (GGM): REFB model (132 MB)
- Historical GPS/Leveling Data (37 KB)
- DEM Data - based on SRTM v4.1:
- Available for download
- Reference: Jarvis, A., H.I. Reuter, A. Nelson, E. Guevara, 2008, Hole-filled SRTM for the globe Version 4, available from the CGIAR-CSI SRTM 90m Database
- Geographic Limits: 35°N - 40°N, 250°E - 258°E
- Grid Spacing: 3” (0.00083333°)
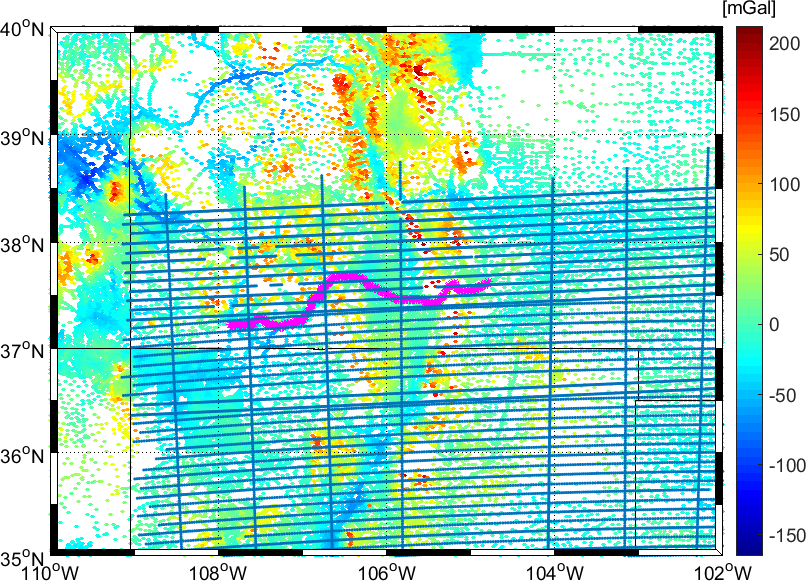
Distribution of terrestrial and GRAV-D gravity observations. The straight lines represent the GRAV-D airborne gravity at flight altitude. The GSVS17 profile (purple curve) is along US Hwy. 160 from Durango to Walsenburg. The color ramp represents the free-air gravity anomalies.
Validation Dataset:
Additionally, an independent geoid comparison for each model was made using the GPS\leveling dataset from NGS’s Geoid Slope Validation Survey 2017, GSVS17. This survey occurred in the rugged terrain of southern Colorado, USA, between the towns of Durango and Walsenburg, along highway US 160.
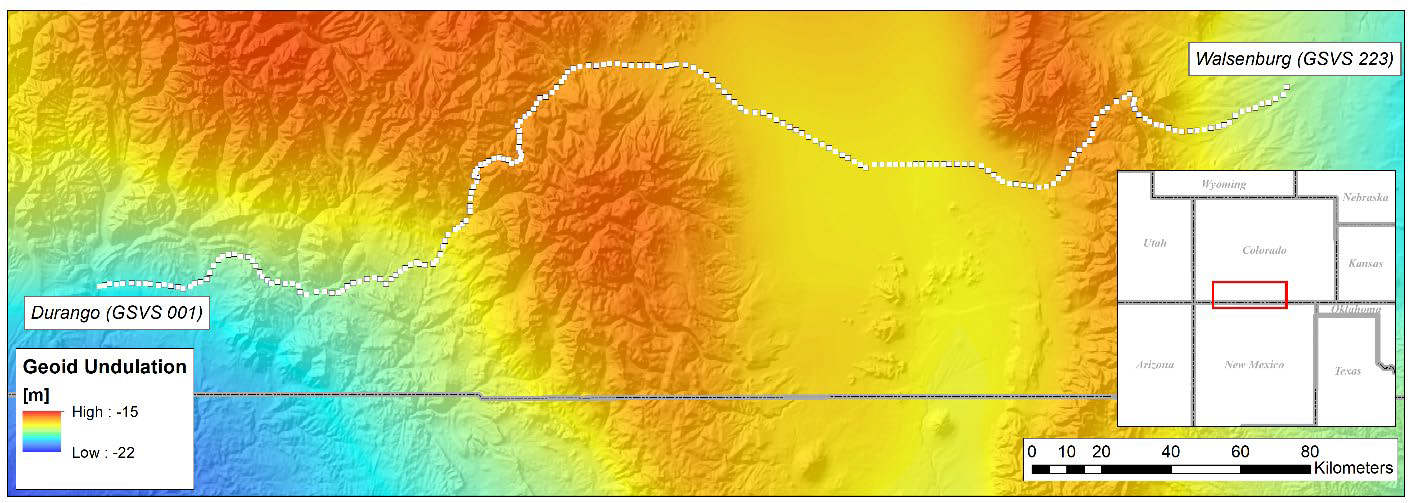
The GSVS17 route between Durango (GSVS 001) to the west and Walsenburg (GSVS 223) to the east. Longitude: 252.1° to 255.2° East, Latitude: 37.2° to 37.7° North.
Contact
Dr. Kevin Ahlgren
- email: Kevin.Ahlgren@noaa.gov
Dr. Yan-Ming Wang
- email: Yan.Wang@noaa.gov

